

Question: Gchter and Schulz (2016) performed a provocative experiment to study intrinsic honesty in different countries. Groups of students were asked to per- form two rolls
Gchter and Schulz (2016) performed a provocative experiment to study intrinsic honesty in different countries. Groups of students were asked to per- form two rolls of a fair die, and to report the result of the first roll. They were paid an amount of money proportional to the reported number, with the exception that they were given no money when they reported rolling a 6. The subjects knew of the monetary reward, and that their rolls were privatethe experimenters could not determine whether they were telling the truth or not. If everybody were to tell the truth, we would expect that each claim (from 0 to 5 monetary units) would be equally represented in the data, with a proportion of 1/6 = 0.16. Countries where cheaters were more abundant would have a higher proportion of subjects claiming a reward of 5 units and a lower proportion of those claiming 0 units.
Load the file (122data.csv) using pandas. Pick one country of your choice, and then make a scatterplot with "Claim" as x-axis and "CumulativeFrequency" as y-axis (for the chosen country only).
Which country reported the smallest frequency of Claim == 0 (meaning fewest honest players)? Which the highest?
Now calculate the reported frequency of rolling the number 5 (which would lead to a claim of 5 units) for each country. Which country has the lowest frequency (most honest players)? Which the highest? Notice that the data report cumulative frequencies; to obtain the frequency of rolling a 5, you need to subtract the cumulative frequency of claiming 4 monetary units from 1.0.
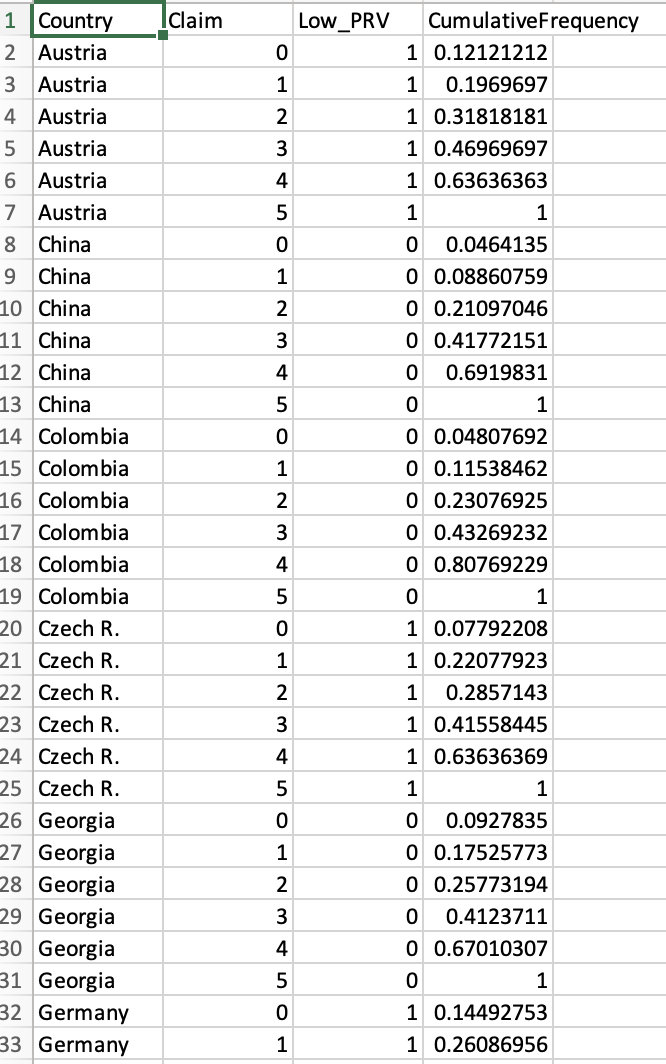
Here is a sample of the file 122data.csv
PYTHON
thank you
Step by Step Solution
There are 3 Steps involved in it

Get step-by-step solutions from verified subject matter experts