

Question: GDI+, Bar Charting, Structures, Bitmap Object, ArrayLists Develop a VB.NET project, using GDI+ (Graphic Device Interface +) to draw a bar chart. The x-axis will
GDI+, Bar Charting, Structures, Bitmap Object, ArrayLists
Develop a VB.NET project, using GDI+ (Graphic Device Interface +) to draw a bar chart. The x-axis will represent a country and a y-axis will represent sales data.
Notes:
Use the GDI+ libraries to create 2-D graphic primitives
Use a Picture Box control to display a Bitmap image of the bar chart
Set appropriate margins, gaps, and scaling where the bitmap bar chart scales if the picture box control orientation changes
Use an ArrayList to store the country and population data (you can make these numbers up)
Use a Structure to declare sales data and country data
Example Output:-
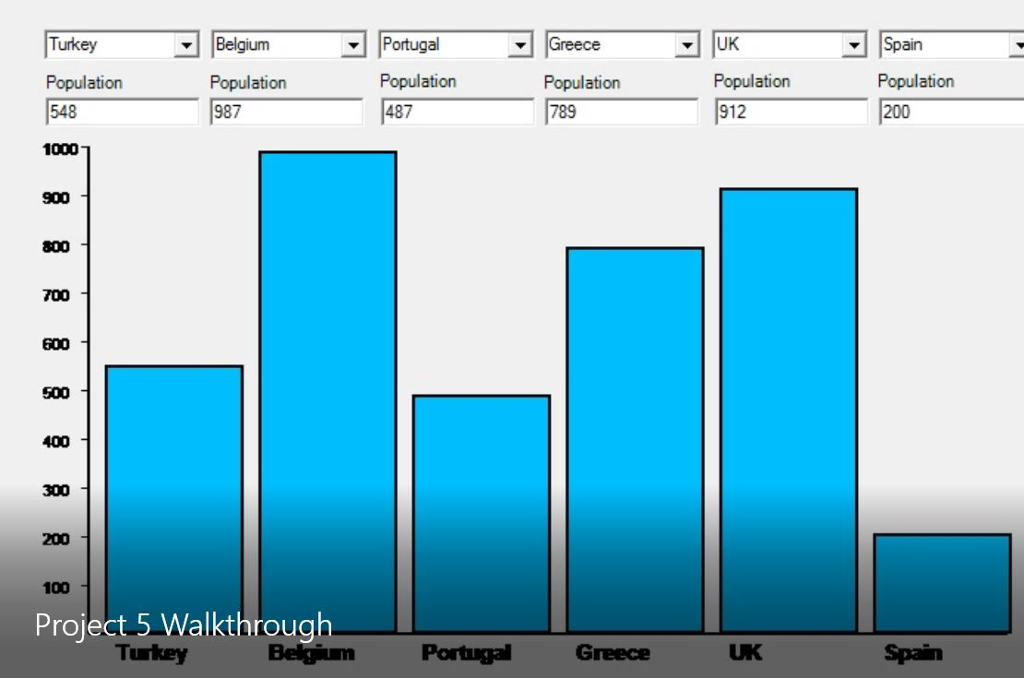
UK Belgium Portugal Spain Turkey Greece Population Population Population Population Population Population 548 987 487 789 912 200 1000 900 500 Project 5 Walkthrough Turkey Belgium Portugal Greece
Step by Step Solution
There are 3 Steps involved in it

Get step-by-step solutions from verified subject matter experts