

Question: General insert Formulas Data Review View Developer Calibri (Bodyl 12 A- A- Wrap Text B T Merge & Center Update To keep up-to-date with security
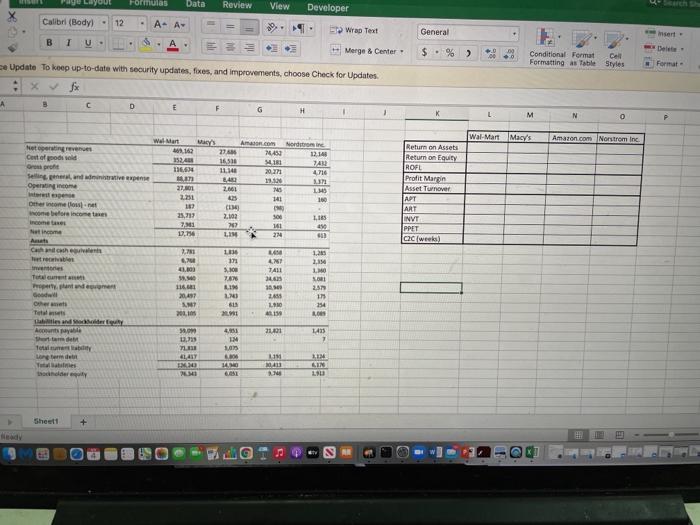
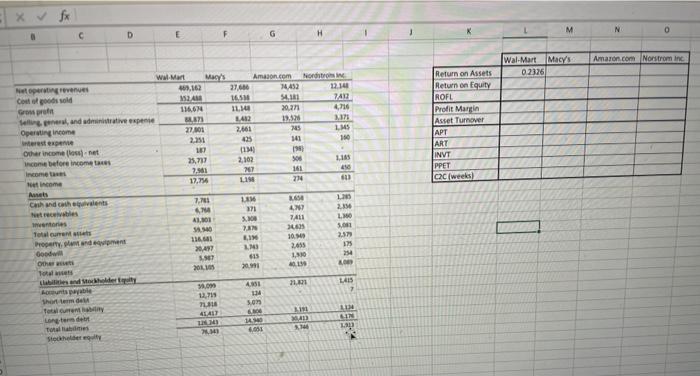
General insert Formulas Data Review View Developer Calibri (Bodyl 12 A- A- Wrap Text B T Merge & Center Update To keep up-to-date with security updates, foxes and improvements, choose Check for Updates . fx A B D E F G H 1 $. % > Conditional Format Cell Formatting as Table Styles Format K L M N 0 P Wal-Mart Macy's Amazon.com Norstrom Inc Meteringen Cart of gods Oro pot Selling and deepen Opercom 162 152.00 116.64 Aman.com Nord 27 21.45 16,510 18 11.14 20:27 Return on Assets Return on Equity ROFL 13.143 74 4716 1312 L. 100 Profit Margin 2.661 Domes. before incontes 27.01 2351 102 25,717 7,90 17.156 10 141 CM 300 141 214 CM 2.102 707 LIM LIES Asset Turnover APT ART INVT PPET Cac weeks) YA 1136 17 Nincome At Cache Tebe ones Toteuta Propeandement Good 2.73 . 4. . 116. 20.497 . 4 TAL 1, 2,150 LM 3.100 LIN 11 SLS 38 21 LI 159 23 173 14 200,00 21.01 Aile Share 33.0 2. 1435 7 4. IM . 60 IAMO 1,4 org terde Totes 111 413 LIM LIN L3 Sheett + 1. Please complete and submit the attached Table of Metrics (8 pts) Answer the following two questions. 2. IWhich metrics does each company perform better on? (3 pts) 3. What supply chain drivers and metrics might explain this difference in performance? (4 pts) fx M N D E F H G Amazon.com Norstroming Wal-Mart Macy's 0.2376 12.14 7412 4710 Amazon.com Nord 27.6 14,453 165 11.14 20.27 1412 19.50 2,061 35 141 11 1981 2.102 267 161 LIN 274 ME ST Return on Assets Return on Equity ROFL Profit margin Asset Turnover APT ART INVT PPET Cac (weeks) 100 LIS 48 Wal-Mart Mary's Nepertrevenues 19,162 Costos sold Group 116,67 Sellers and dative expense MT Operving income 27.01 ersten 2.251 Other income fosse 100 Icone before income taxes 25.730 Income 7,01 to come 17,754 Aucts Cath and cathetents 7,701 receiveles mentors 41,101 Totale SA Property and event 116.61 Good Othe Total 2015 Land Modely table 1.099 | 12,719 TUL 414 M 219 AN LI NIE E 7411 BAS 30. 2015 110 25 LIM 11 615 2001 KI 254 21. LAS > 4 14 3.07 11 TO LAD Stohy General insert Formulas Data Review View Developer Calibri (Bodyl 12 A- A- Wrap Text B T Merge & Center Update To keep up-to-date with security updates, foxes and improvements, choose Check for Updates . fx A B D E F G H 1 $. % > Conditional Format Cell Formatting as Table Styles Format K L M N 0 P Wal-Mart Macy's Amazon.com Norstrom Inc Meteringen Cart of gods Oro pot Selling and deepen Opercom 162 152.00 116.64 Aman.com Nord 27 21.45 16,510 18 11.14 20:27 Return on Assets Return on Equity ROFL 13.143 74 4716 1312 L. 100 Profit Margin 2.661 Domes. before incontes 27.01 2351 102 25,717 7,90 17.156 10 141 CM 300 141 214 CM 2.102 707 LIM LIES Asset Turnover APT ART INVT PPET Cac weeks) YA 1136 17 Nincome At Cache Tebe ones Toteuta Propeandement Good 2.73 . 4. . 116. 20.497 . 4 TAL 1, 2,150 LM 3.100 LIN 11 SLS 38 21 LI 159 23 173 14 200,00 21.01 Aile Share 33.0 2. 1435 7 4. IM . 60 IAMO 1,4 org terde Totes 111 413 LIM LIN L3 Sheett + 1. Please complete and submit the attached Table of Metrics (8 pts) Answer the following two questions. 2. IWhich metrics does each company perform better on? (3 pts) 3. What supply chain drivers and metrics might explain this difference in performance? (4 pts) fx M N D E F H G Amazon.com Norstroming Wal-Mart Macy's 0.2376 12.14 7412 4710 Amazon.com Nord 27.6 14,453 165 11.14 20.27 1412 19.50 2,061 35 141 11 1981 2.102 267 161 LIN 274 ME ST Return on Assets Return on Equity ROFL Profit margin Asset Turnover APT ART INVT PPET Cac (weeks) 100 LIS 48 Wal-Mart Mary's Nepertrevenues 19,162 Costos sold Group 116,67 Sellers and dative expense MT Operving income 27.01 ersten 2.251 Other income fosse 100 Icone before income taxes 25.730 Income 7,01 to come 17,754 Aucts Cath and cathetents 7,701 receiveles mentors 41,101 Totale SA Property and event 116.61 Good Othe Total 2015 Land Modely table 1.099 | 12,719 TUL 414 M 219 AN LI NIE E 7411 BAS 30. 2015 110 25 LIM 11 615 2001 KI 254 21. LAS > 4 14 3.07 11 TO LAD Stohy
Step by Step Solution
There are 3 Steps involved in it

Get step-by-step solutions from verified subject matter experts