

Question: generate a random set of data 1 0 0 points long between 6 0 and 8 0 ; these will be understood as temperature samples
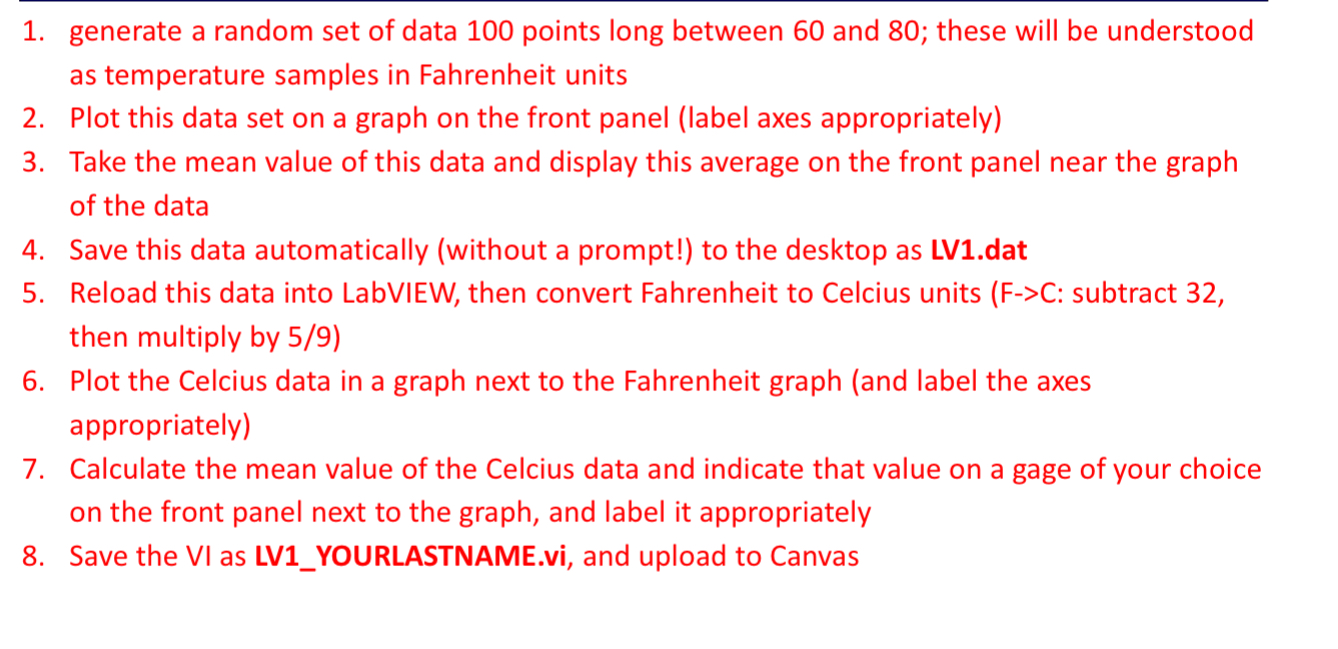
generate a random set of data points long between and ; these will be understood
as temperature samples in Fahrenheit units
Plot this data set on a graph on the front panel label axes appropriately
Take the mean value of this data and display this average on the front panel near the graph
of the data
Save this data automatically without a prompt! to the desktop as LVdat
Reload this data into LabVIEW, then convert Fahrenheit to Celcius units FC: subtract
then multiply by
Plot the Celcius data in a graph next to the Fahrenheit graph and label the axes
appropriately
Calculate the mean value of the Celcius data and indicate that value on a gage of your choice
on the front panel next to the graph, and label it appropriately
Save the VI as LVYOURLASTNAME.vi and upload to Canvas
Step by Step Solution
There are 3 Steps involved in it
1 Expert Approved Answer
Step: 1 Unlock

Question Has Been Solved by an Expert!
Get step-by-step solutions from verified subject matter experts
Step: 2 Unlock
Step: 3 Unlock