

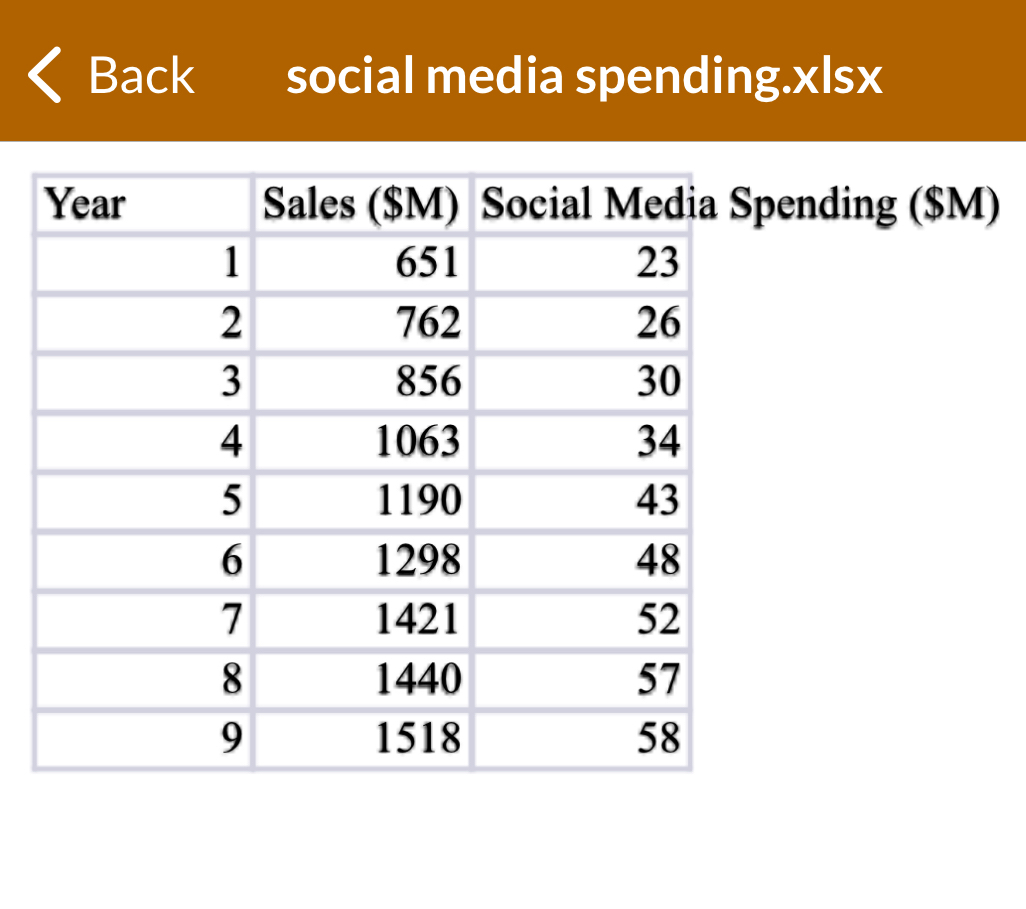
Question: generate a regression plot based on sales ( Y - axis ) and social media spending ( X - axis ) . You can use
generate a regression plot based on sales Yaxis and social media spending Xaxis You can use Excel, Word, or Painter. Back
social media spending.xlsx
tableYearSales $MSocial Media
Step by Step Solution
There are 3 Steps involved in it
1 Expert Approved Answer
Step: 1 Unlock

Question Has Been Solved by an Expert!
Get step-by-step solutions from verified subject matter experts
Step: 2 Unlock
Step: 3 Unlock