

Question: Using d3.v3.min.js (https://d3js.org/d3.v3.min.js) to create index.html. The following should be written in HTML: 1. Generate and plot 50 objects: 25 circles and 25 upward-pointing equilateral
Using d3.v3.min.js (https://d3js.org/d3.v3.min.js) to create index.html. The following should be written in HTML:
1. Generate and plot 50 objects: 25 circles and 25 upward-pointing equilateral triangles. Each object’s X and Y coordinates should be a random integer between 0 and 100 inclusively (i.e., [0, 100]). An object’s X and Y coordinates should be independently computed. Each object’s size will be a value between 5 and 50 inclusively (i.e., [5, 50]). You should use the “symbol.size()” function of d3 to adjust the size of the object. Use the object’s X coordinate to determine the size of the object. You should use a linear scale for the size, to map the domain of X values to the range of [5,50]. Objects with larger x coordinate values should have larger sizes. This link (https://github.com/d3/d3-3.x-api-reference/blob/master/SVG-Shapes.md#symbol_size) explains how size is interpreted by symbol.size(). You may want to look at this example (http://bl.ocks.org/kiranml1/6972900) for the usage of “symbol.size()” function.
2. The plot must have visible X and Y axes whose range of values linearly scale according to the coordinates of the generated objects. The ticks on these axes should adjust automatically based on the randomly generated scatterplot objects.
3. Your full name (in upper case) should appear above the scatterplot.
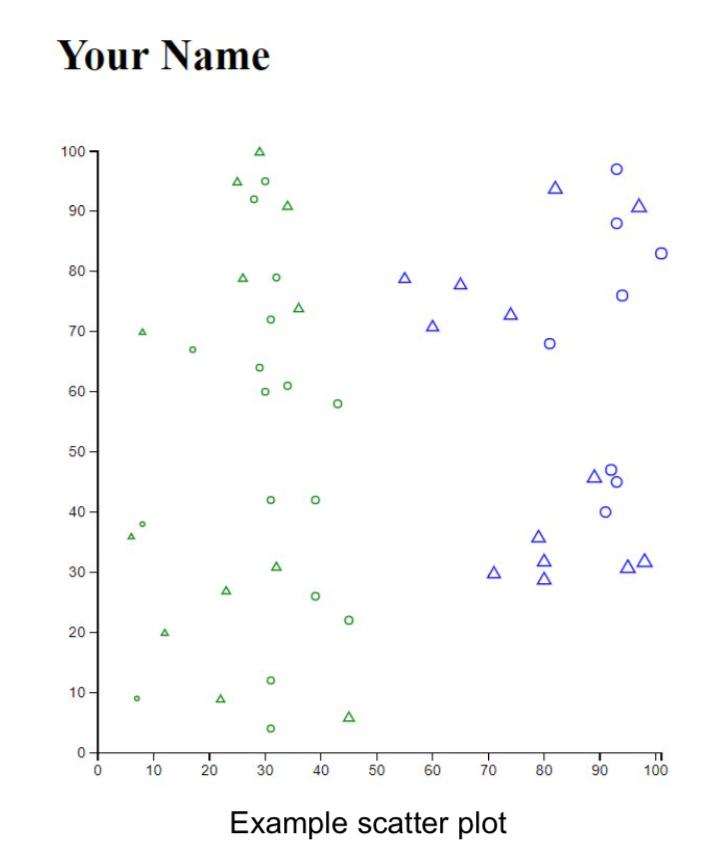
Your Name 100- 90- 80- 70- 60- 50- 40 30- 20 10 0- 0 O 10 O 4 20 0 4 30 0 40 50 60 70 Example scatter plot 80 48 90 44 100
Step by Step Solution
3.38 Rating (185 Votes )
There are 3 Steps involved in it
D3js is a JavaScript library for manipulating documents based on data D3 helps you bring data to life using HTML SVG and CSS D3s emphasis on web standards gives you the full capabilities of modern bro... View full answer

Get step-by-step solutions from verified subject matter experts