

Question: Geog 1502: Mapping Our World | 1 Lab 4: Analysis Overview. In this lab, you will analyze the distribution of store chains in the Midwest
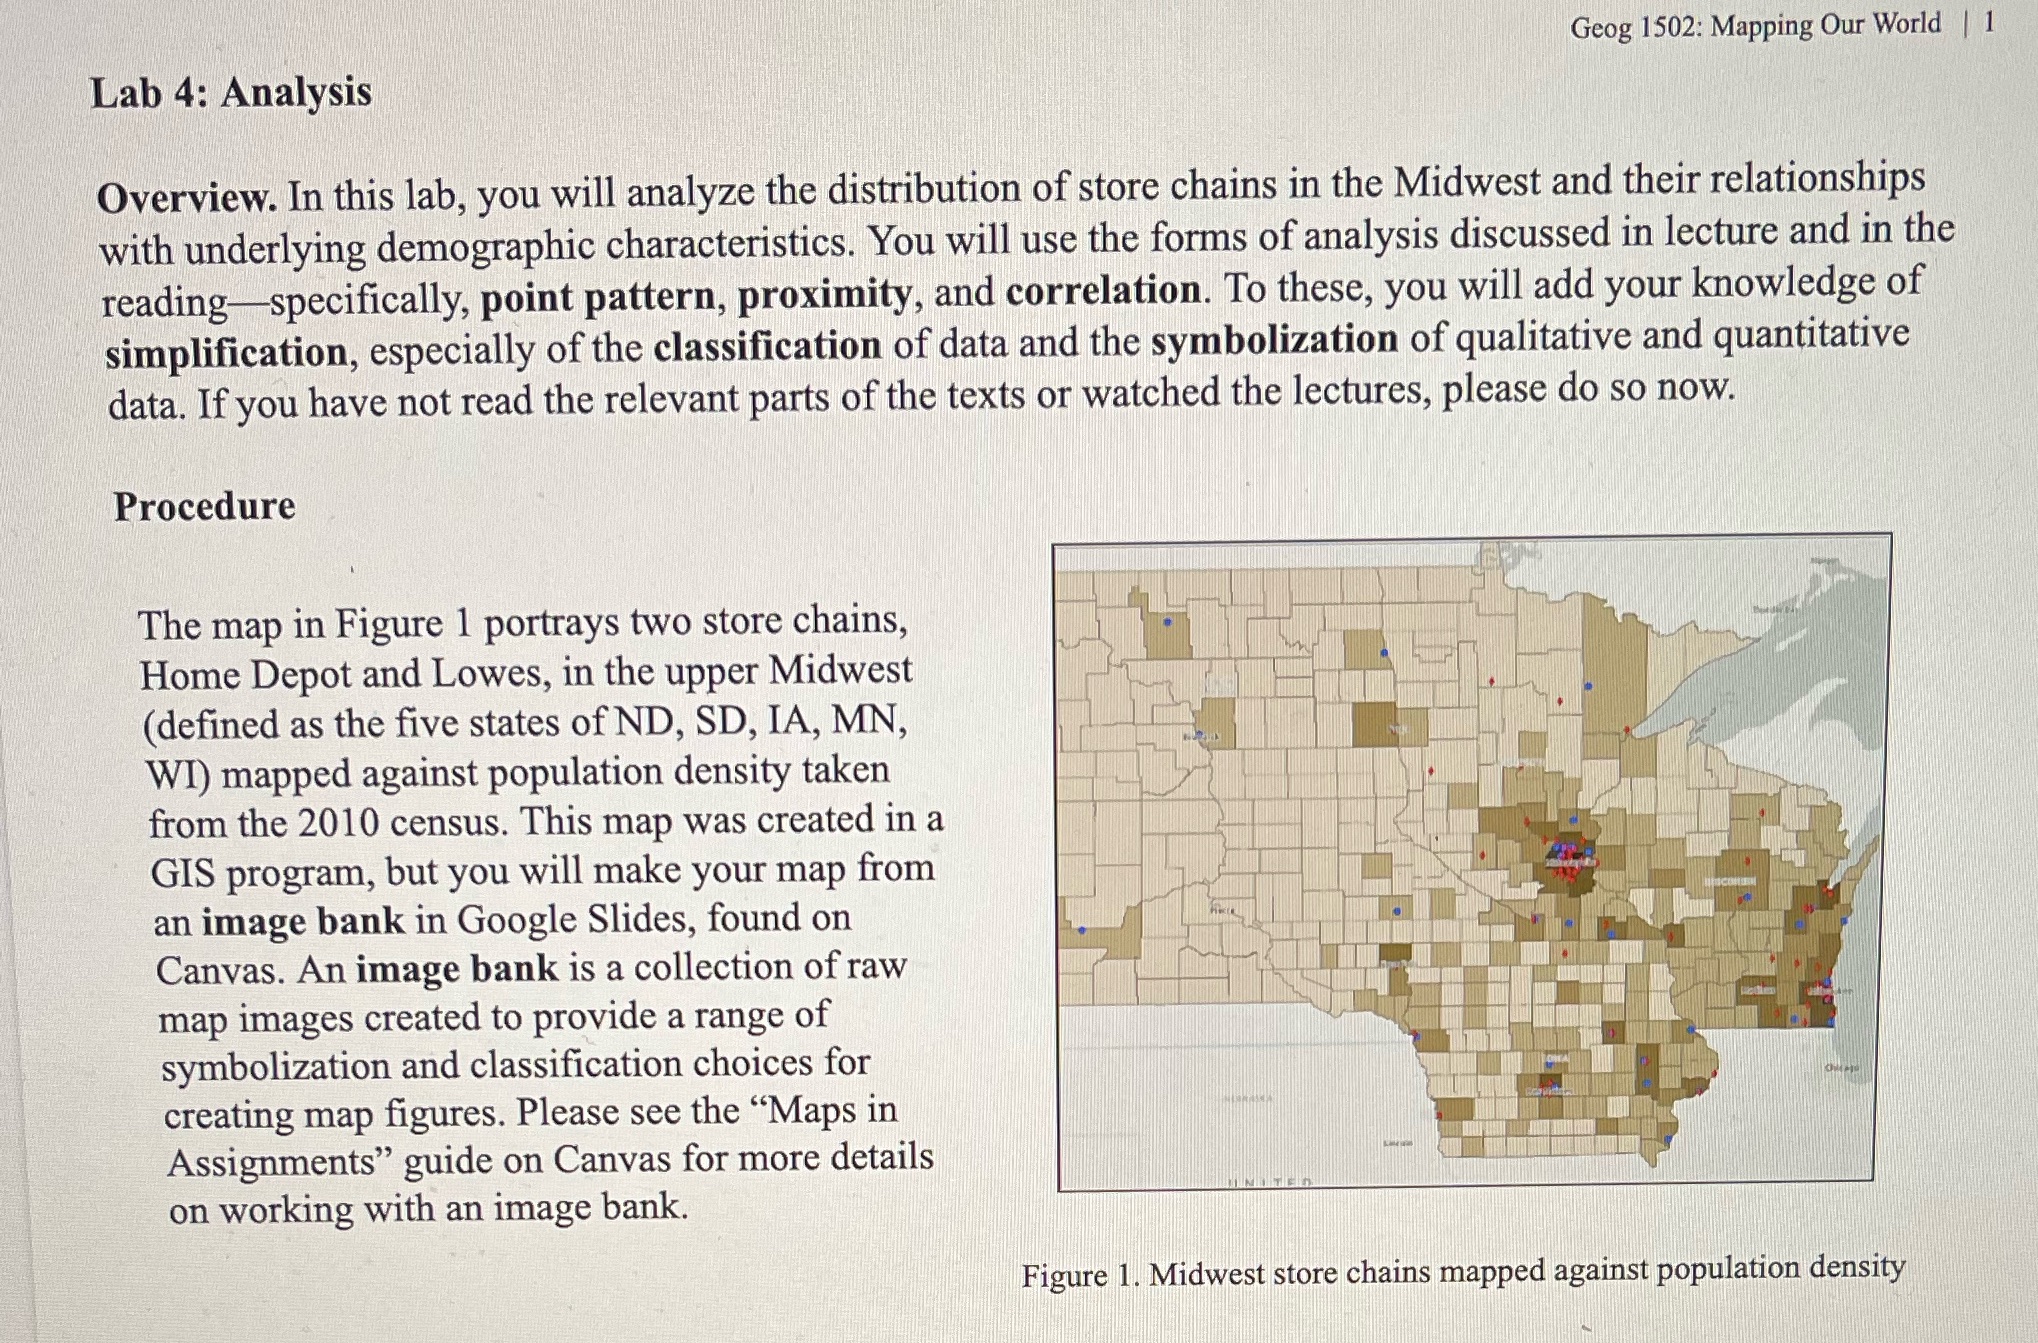
Geog 1502: Mapping Our World | 1 Lab 4: Analysis Overview. In this lab, you will analyze the distribution of store chains in the Midwest and their relationships with underlying demographic characteristics. You will use the forms of analysis discussed in lecture and in the reading-specifically, point pattern, proximity, and correlation. To these, you will add your knowledge of simplification, especially of the classification of data and the symbolization of qualitative and quantitative data. If you have not read the relevant parts of the texts or watched the lectures, please do so now. Procedure The map in Figure 1 portrays two store chains, Home Depot and Lowes, in the upper Midwest ( defined as the five states of ND, SD, IA, MN, WI) mapped against population density taken from the 2010 census. This map was created in a GIS program, but you will make your map from an image bank in Google Slides, found on Canvas. An image bank is a collection of raw map images created to provide a range of symbolization and classification choices for creating map figures. Please see the "Maps in Assignments" guide on Canvas for more details on working with an image bank. Figure 1. Midwest store chains mapped against population density
Step by Step Solution
There are 3 Steps involved in it

Get step-by-step solutions from verified subject matter experts