

Question: Geometry w/D X Geometry w/D X Geometry w/D X Geometry w/D X S 12.04 Trend Li X Schoology X S Schoology X Course Hero (84)
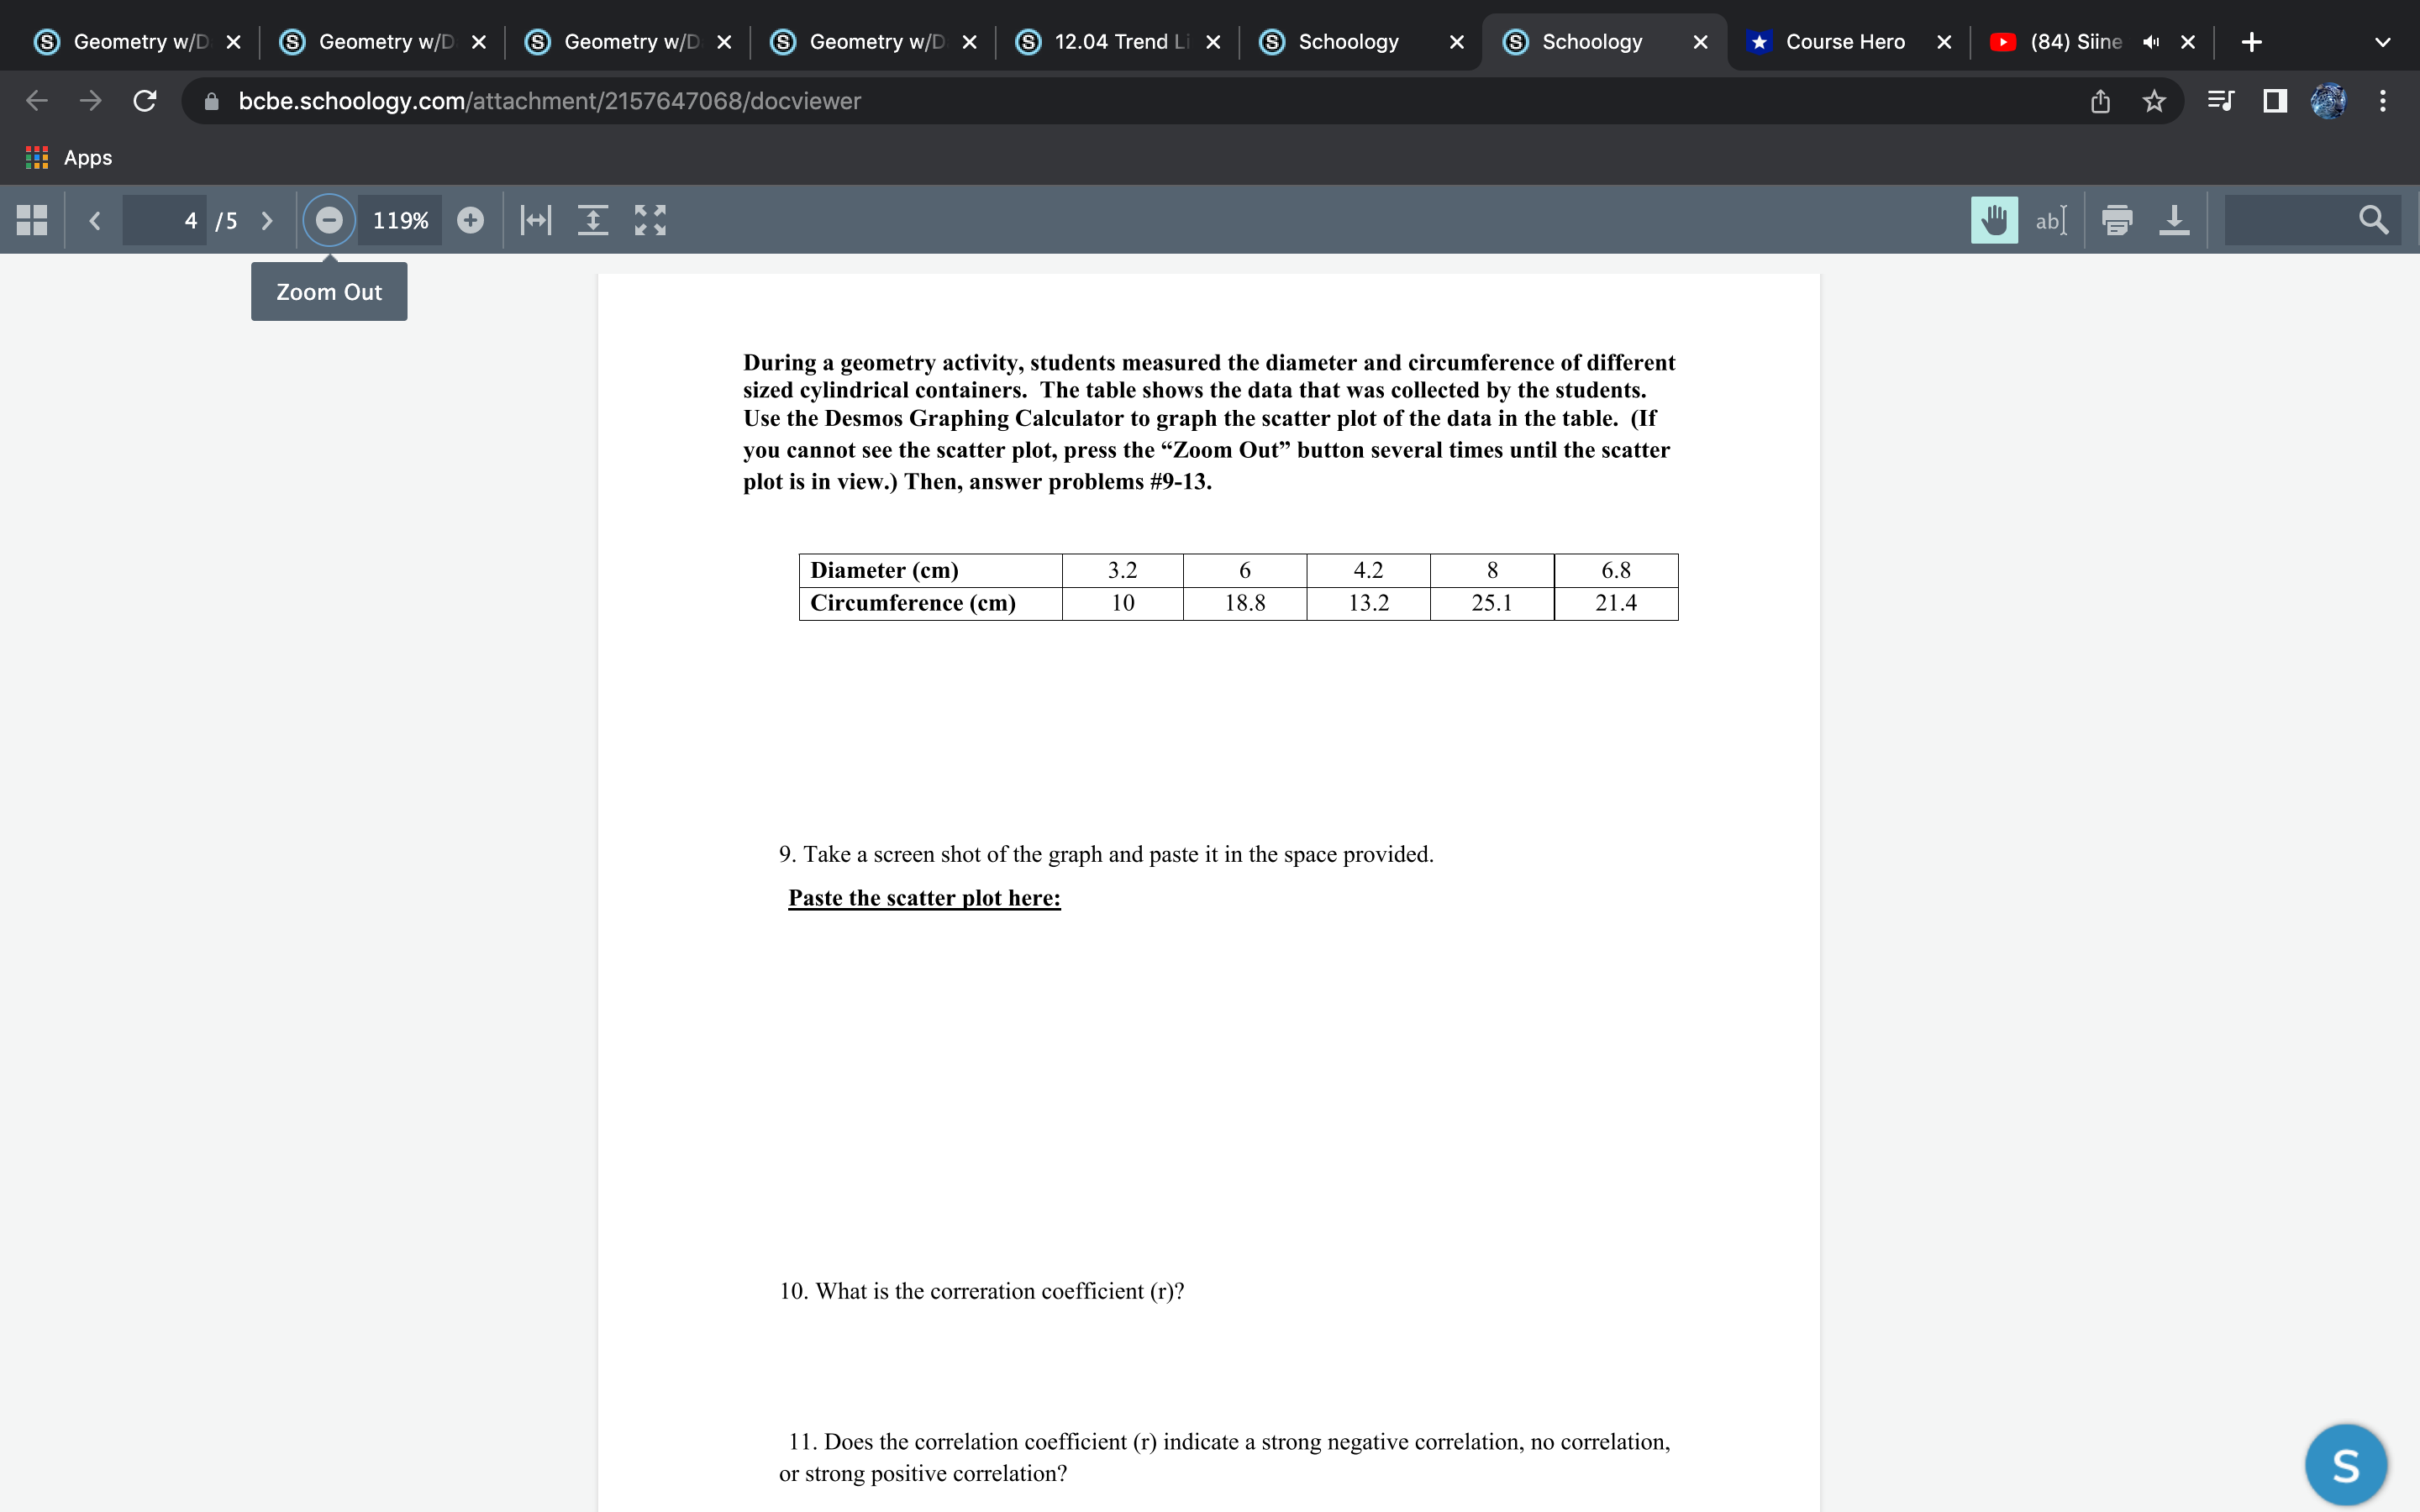
Geometry w/D X Geometry w/D X Geometry w/D X Geometry w/D X S 12.04 Trend Li X Schoology X S Schoology X Course Hero (84) Siine 41 X C bcbe.schoology.com/attachment/2157647068/docviewer Er Apps 4 15 > 119%+ | ab Q Zoom Out During a geometry activity, students measured the diameter and circumference of different sized cylindrical containers. The table shows the data that was collected by the students. Use the Desmos Graphing Calculator to graph the scatter plot of the data in the table. (If you cannot see the scatter plot, press the "Zoom Out" button several times until the scatter plot is in view.) Then, answer problems #9-13. Diameter (cm) 3.2 6 4.2 8 6.8 Circumference (cm) 10 18.8 13.2 25.1 21.4 9. Take a screen shot of the graph and paste it in the space provided. Paste the scatter plot here: 10. What is the correration coefficient (r)? 11. Does the correlation coefficient (r) indicate a strong negative correlation, no correlation, or strong positive correlation? SGeometry w/D X Geometry w/D X Geometry w/D X Geometry w/D X S 12.04 Trend Li X Schoology X S Schoology X Course Hero (84) Siine 41 X C bcbe.schoology.com/attachment/2157647068/docviewer Er Apps 5 15 > 236% + )|4 I ab 12. What is the equation of the line of best fit? 13. Use the equation of the line of best fit from #9 to estimate the circumference if the diameter is 3.4 cm. Show your work. Estimate = S
Step by Step Solution
There are 3 Steps involved in it

Get step-by-step solutions from verified subject matter experts