

Get statistical data from our statistical database and analyze the relationship between GDP and government spending/money supply.
Question:
Get statistical data from our statistical database and analyze the relationship between GDP and government spending/money supply.
Get the data you need from the OECD and World Bank statistical databases, as well as the websites of the Bureau of Statistics and the Bank of Japan.
? GDP
? Financial expenditure
? Money supply (money stock) or monetary base
Get the data and analyze the impact of government spending and the money supply on GDP.
? Trends and tendencies of statistical data using line graphs, etc.
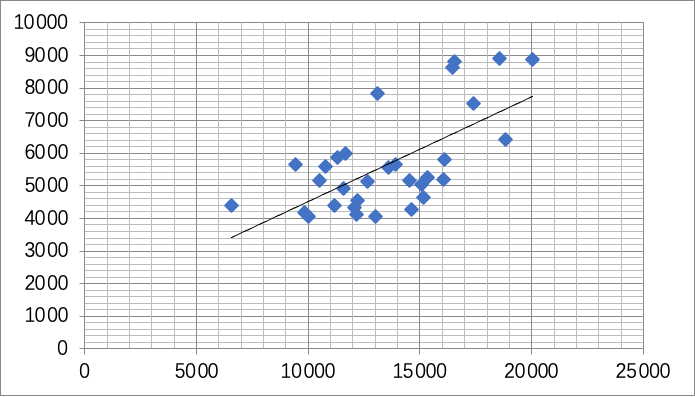
? Consideration of relevance using scatter plots
? Calculation of correlation coefficient
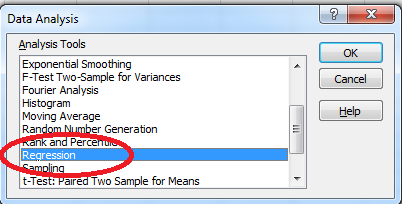
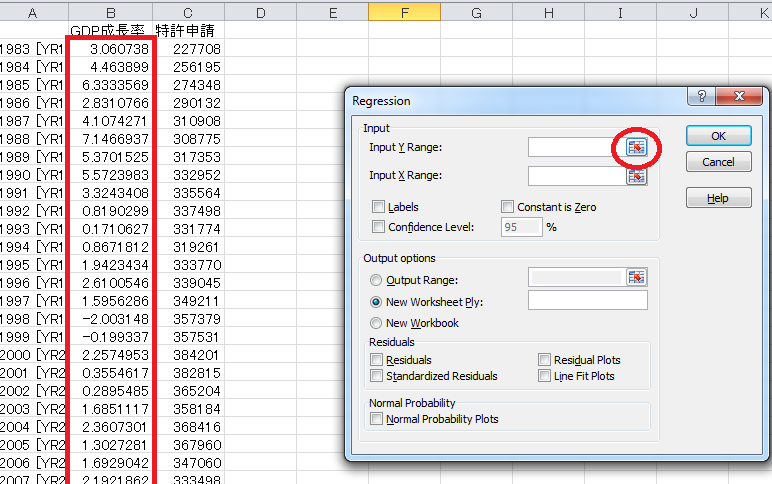
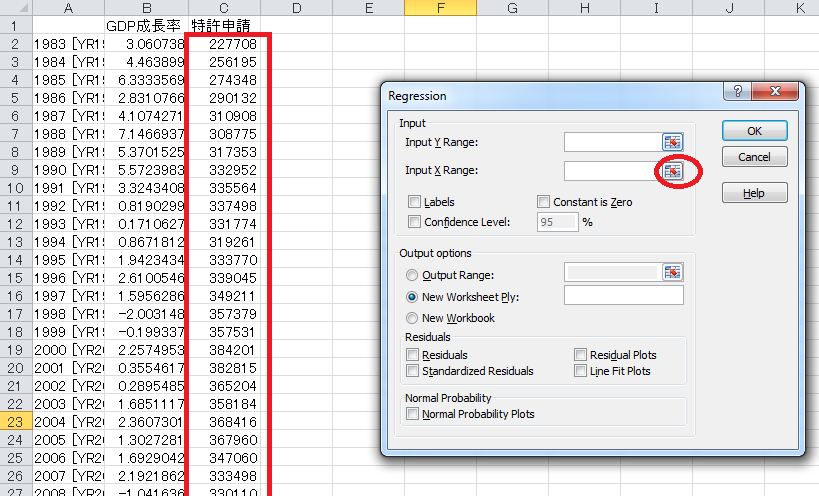
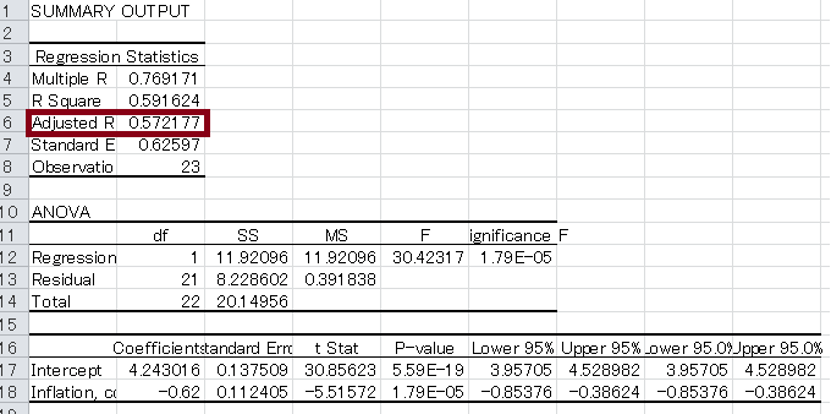
? Regression analysis (optional)
Based on the results of the analysis, consider the effects of fiscal and monetary policies based on the theory of the multiplier effect and the IS-LM model, and summarize them in a brief report.
The data used for analysis can be cross-sectional (multiple countries, single year) or time series (single country, multiple years). Include at least 20 or more observations.
This is the report template, please answer it.
1. Introduction
?
2. Theoretical background
?
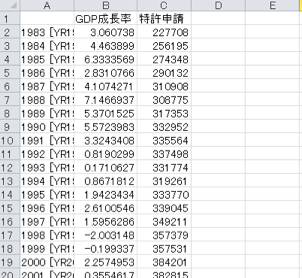
3. Long-term trends with line graphs (for each statistic)
?
(analysis of line graph)
4. correlation
?
(Analysis of scatter plots and correlation coefficients)
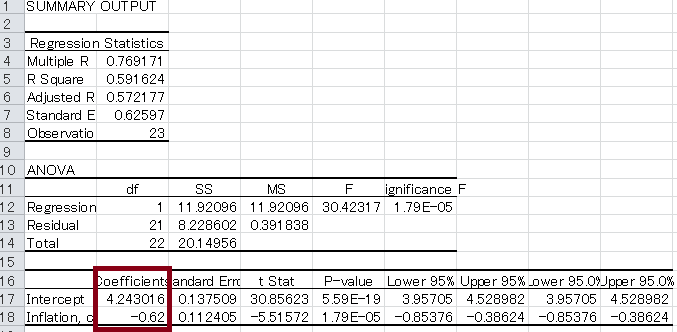
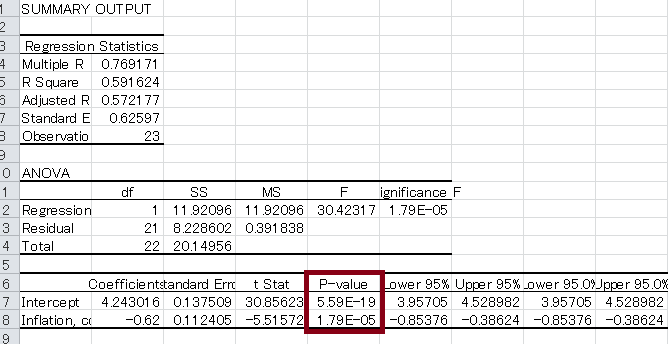
5.. Demonstration by regression analysis
?
(Regression analysis results)
6. Discussion of analysis results
?
(Consideration based on the above analysis)
7. Conclusion
?
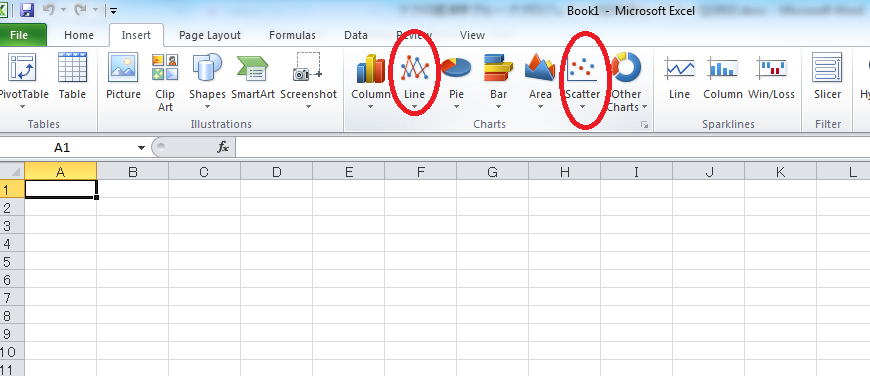
How to create line charts and scatter charts in Excel
Insert tab ? Select Line or Scatter
Expert Answer:
Here is the report analyzing the relationship between GDP government spending and money supply 1 Introduction This report analyzes the impact of fisca... View the full answer


Social Statistics For A Diverse Society
ISBN: 9781483333540
7th Edition
Authors: Chava Frankfort Nachmias, Anna Leon Guerrero
