

Question: Getta Byte software is a new billing system that need to develop and implement. Instructions Review the Week 6 Getta Byte Software Risk Management video
 Getta Byte software is a new billing system that need to develop and implement.
Instructions
- Review the Week 6 Getta Byte Software Risk Management video located in the Week 6 Lesson; the video provides examples of 3 negative risks.
- Apply the risk management process learned in the Week 6 reading assignments (i.e., Chapter 11 of the Contemporary Project Management textbook and Part 1 Section 11 of the PMBOK Guide. to identify, assess, and plan risk responses for five positive and five negative risks other than the examples provided in the video using the Risk Register Template located in the Project Templates section below.
- For the risk identification process, be sure to assess the following process inputs: 1) Internal and external enterprise environmental factors and 2) the organizational process assets. Next, proceed to complete the following identification columns in the Risk Register Template.
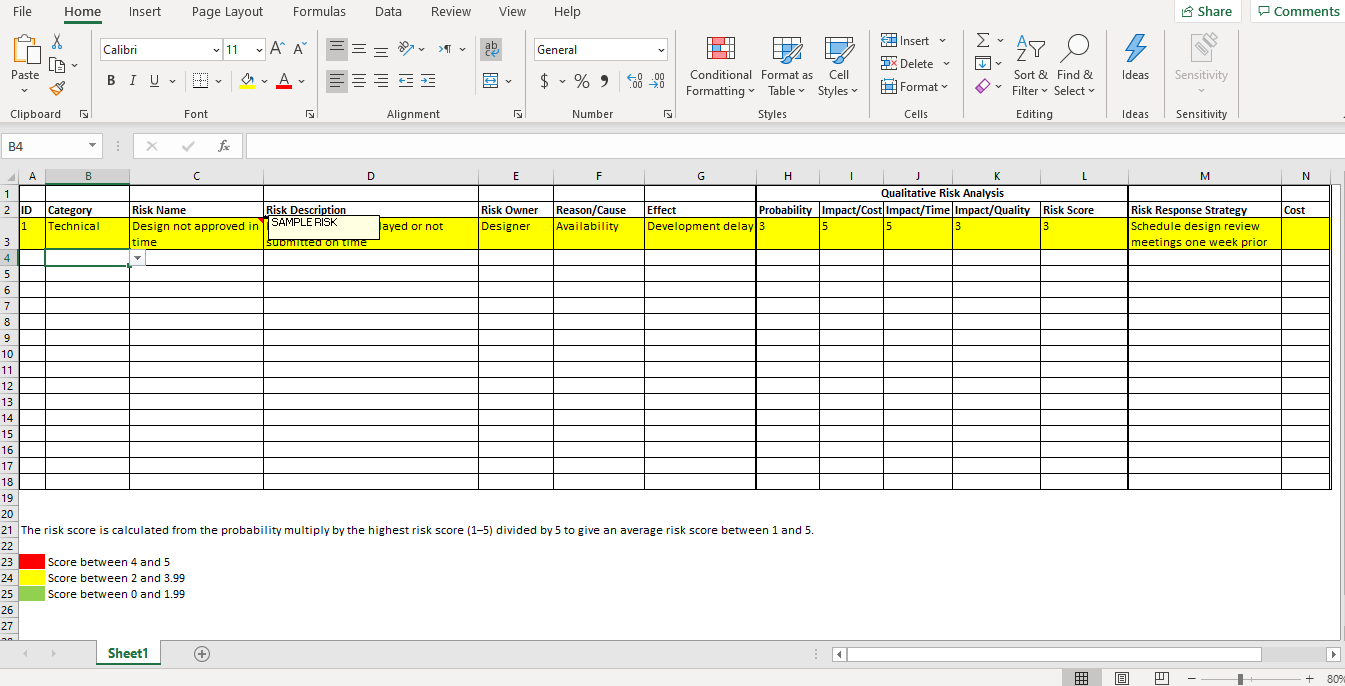
- Category
- Risk Name
- Risk Description
- Risk Owner
- Reason/Root Cause
- Effect/Impact on Project Objectives
- For the assessment process complete the following columns.
- Probability of occurrence
- Impact/Cost
- Impact/Time
- Impact/Quality
- Risk Score (i.e., probability times impact)
- For the Plan Risk Response process complete the following columns.
- Risk Response Strategy
- Cost
- For the risk identification process, be sure to assess the following process inputs: 1) Internal and external enterprise environmental factors and 2) the organizational process assets. Next, proceed to complete the following identification columns in the Risk Register Template.
Step by Step Solution
There are 3 Steps involved in it
1 Expert Approved Answer
Step: 1 Unlock

Question Has Been Solved by an Expert!
Get step-by-step solutions from verified subject matter experts
Step: 2 Unlock
Step: 3 Unlock