

Question: ggplot2 Exercises Recreate the following plots shown below. Don't worry if your plots don't match exactly what is shown below, as long as you have
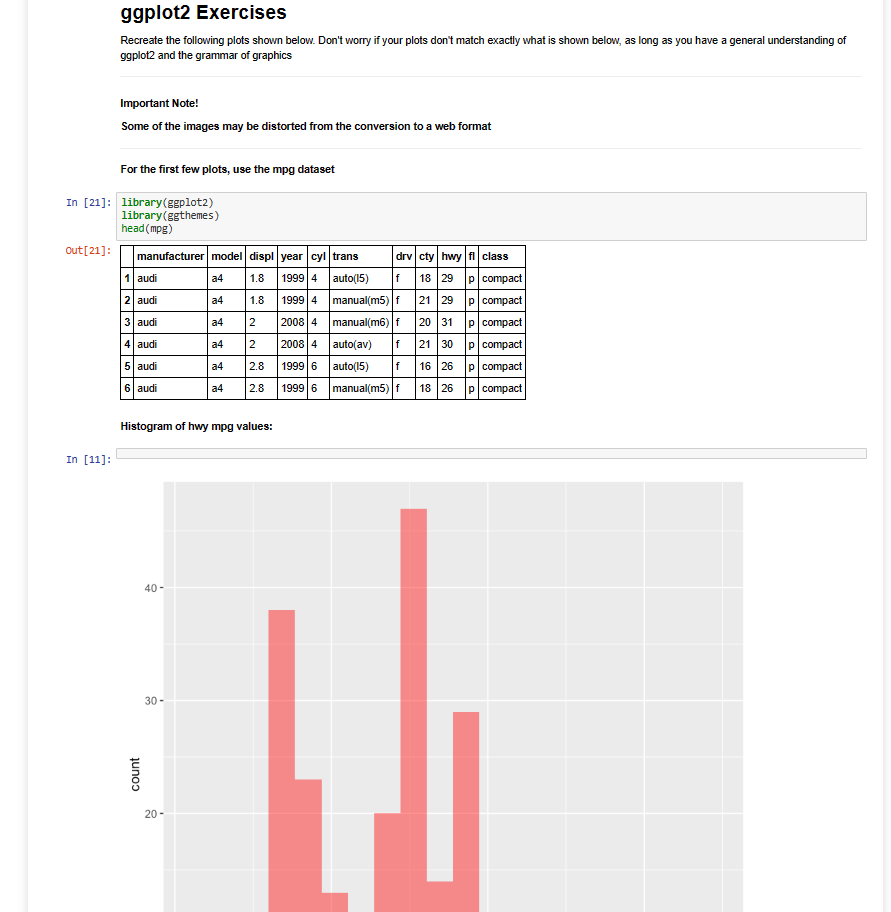
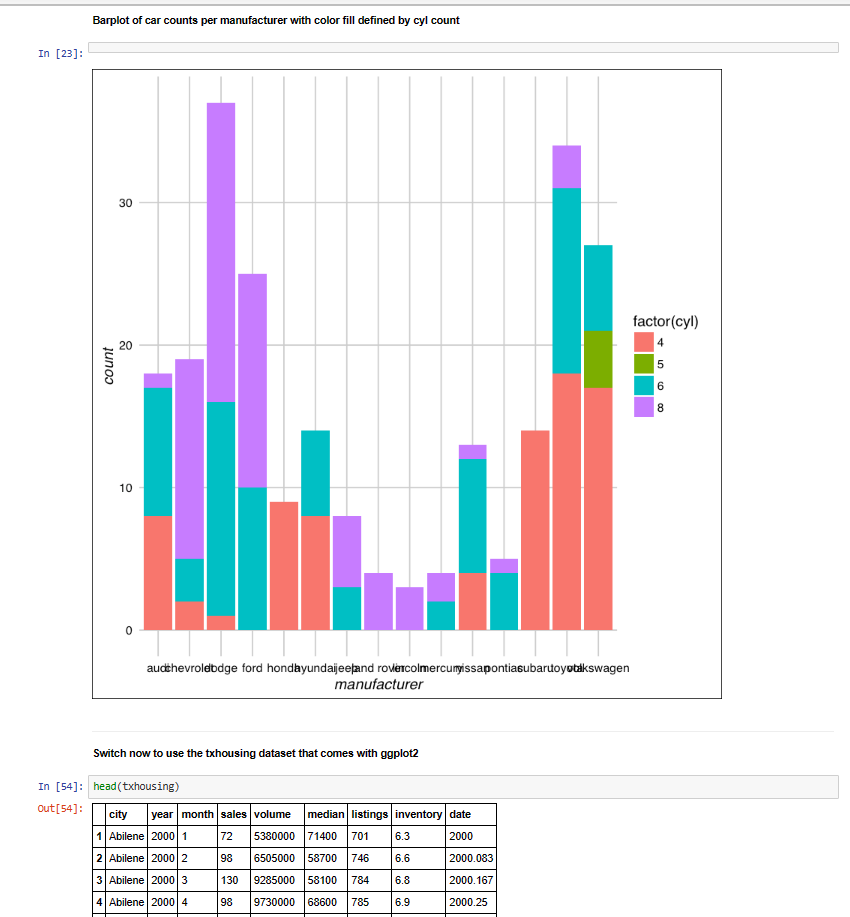
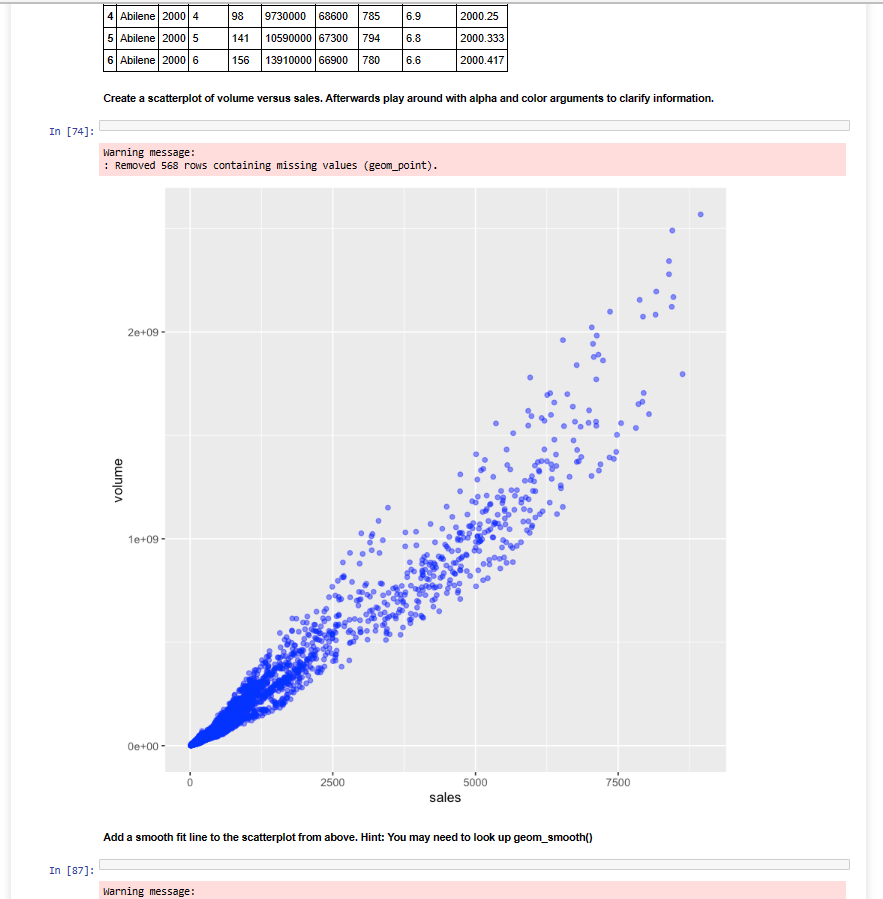
ggplot2 Exercises Recreate the following plots shown below. Don't worry if your plots don't match exactly what is shown below, as long as you have a general understanding of ggplot2 and the grammar of graphics Important Note! Some of the images may be distorted from the conversion to a web format For the first few plots, use the mpg dataset library(ggplot2) library(ggthemes) head(mpg) Histogram of hwy mpg values: Barplot of car counts per manufacturer with color fill defined by cyl count Switch now to use the txhousing dataset that comes with ggplot2 head(txhousing) Warning message
Step by Step Solution
There are 3 Steps involved in it
1 Expert Approved Answer
Step: 1 Unlock

Question Has Been Solved by an Expert!
Get step-by-step solutions from verified subject matter experts
Step: 2 Unlock
Step: 3 Unlock