

Question: Give a substantive response to describe or explain the data points on the graph Figure 2. Summary of Crimes Reported by Siler City Police Department
Give a substantive response to describe or explain the data points on the graph
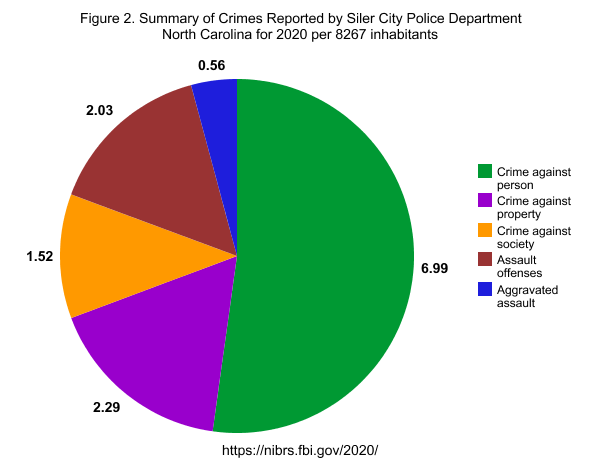
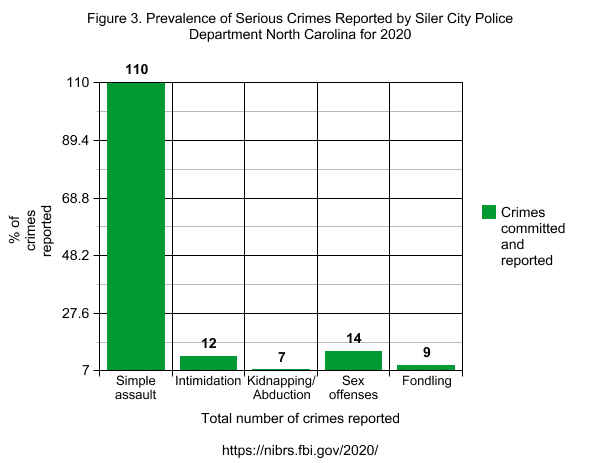
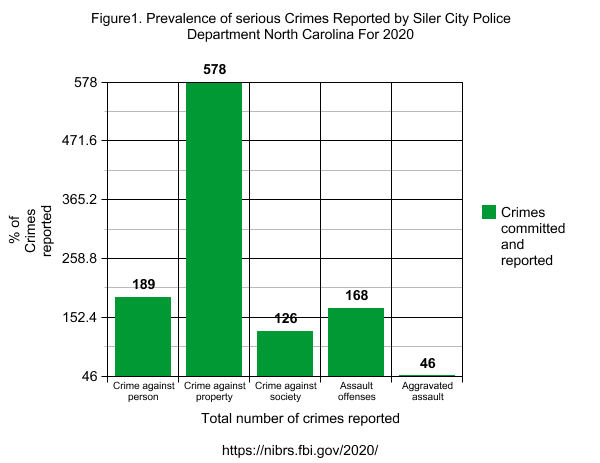
Figure 2. Summary of Crimes Reported by Siler City Police Department North Carolina for 2020 per 8267 inhabitants 0.56 2.03 Crime against person Crime against property Crime against society 1.52 Assault 6.99 offenses Aggravated assault 2.29 https:/ibrs.fbi.gov/2020/Figure 3. Prevalence of Serious Crimes Reported by Siler City Police Department North Carolina for 2020 110 110 89.4 68.8 Crimes % of crimes reported committed and 48.2 reported 27.6 12 14 7 9 7+ Simple "Intimidation 'Kidnapping/ Sex Fondling assault Abduction offenses Total number of crimes reported https:/ibrs.fbi.gov/2020/Figure1. Prevalence of serious Crimes Reported by Siler City Police Department North Carolina For 2020 578 578 471.6 365.2 Crimes % of Crimes reported committed and 258.8 reported 189 168 152.4 126 46 46+ Crime against ' Crime against' Crime against Assault Aggravated person property society offenses Total number of crimes reported https:/ibrs.fbi.gov/2020/
Step by Step Solution
There are 3 Steps involved in it

Get step-by-step solutions from verified subject matter experts