

Question: Give answer 1. (5 points) Complete the Instructor and Class Time information on the cover sheet. True/False Multiple Choice CIRCLE the best answer (3 points
Give answer
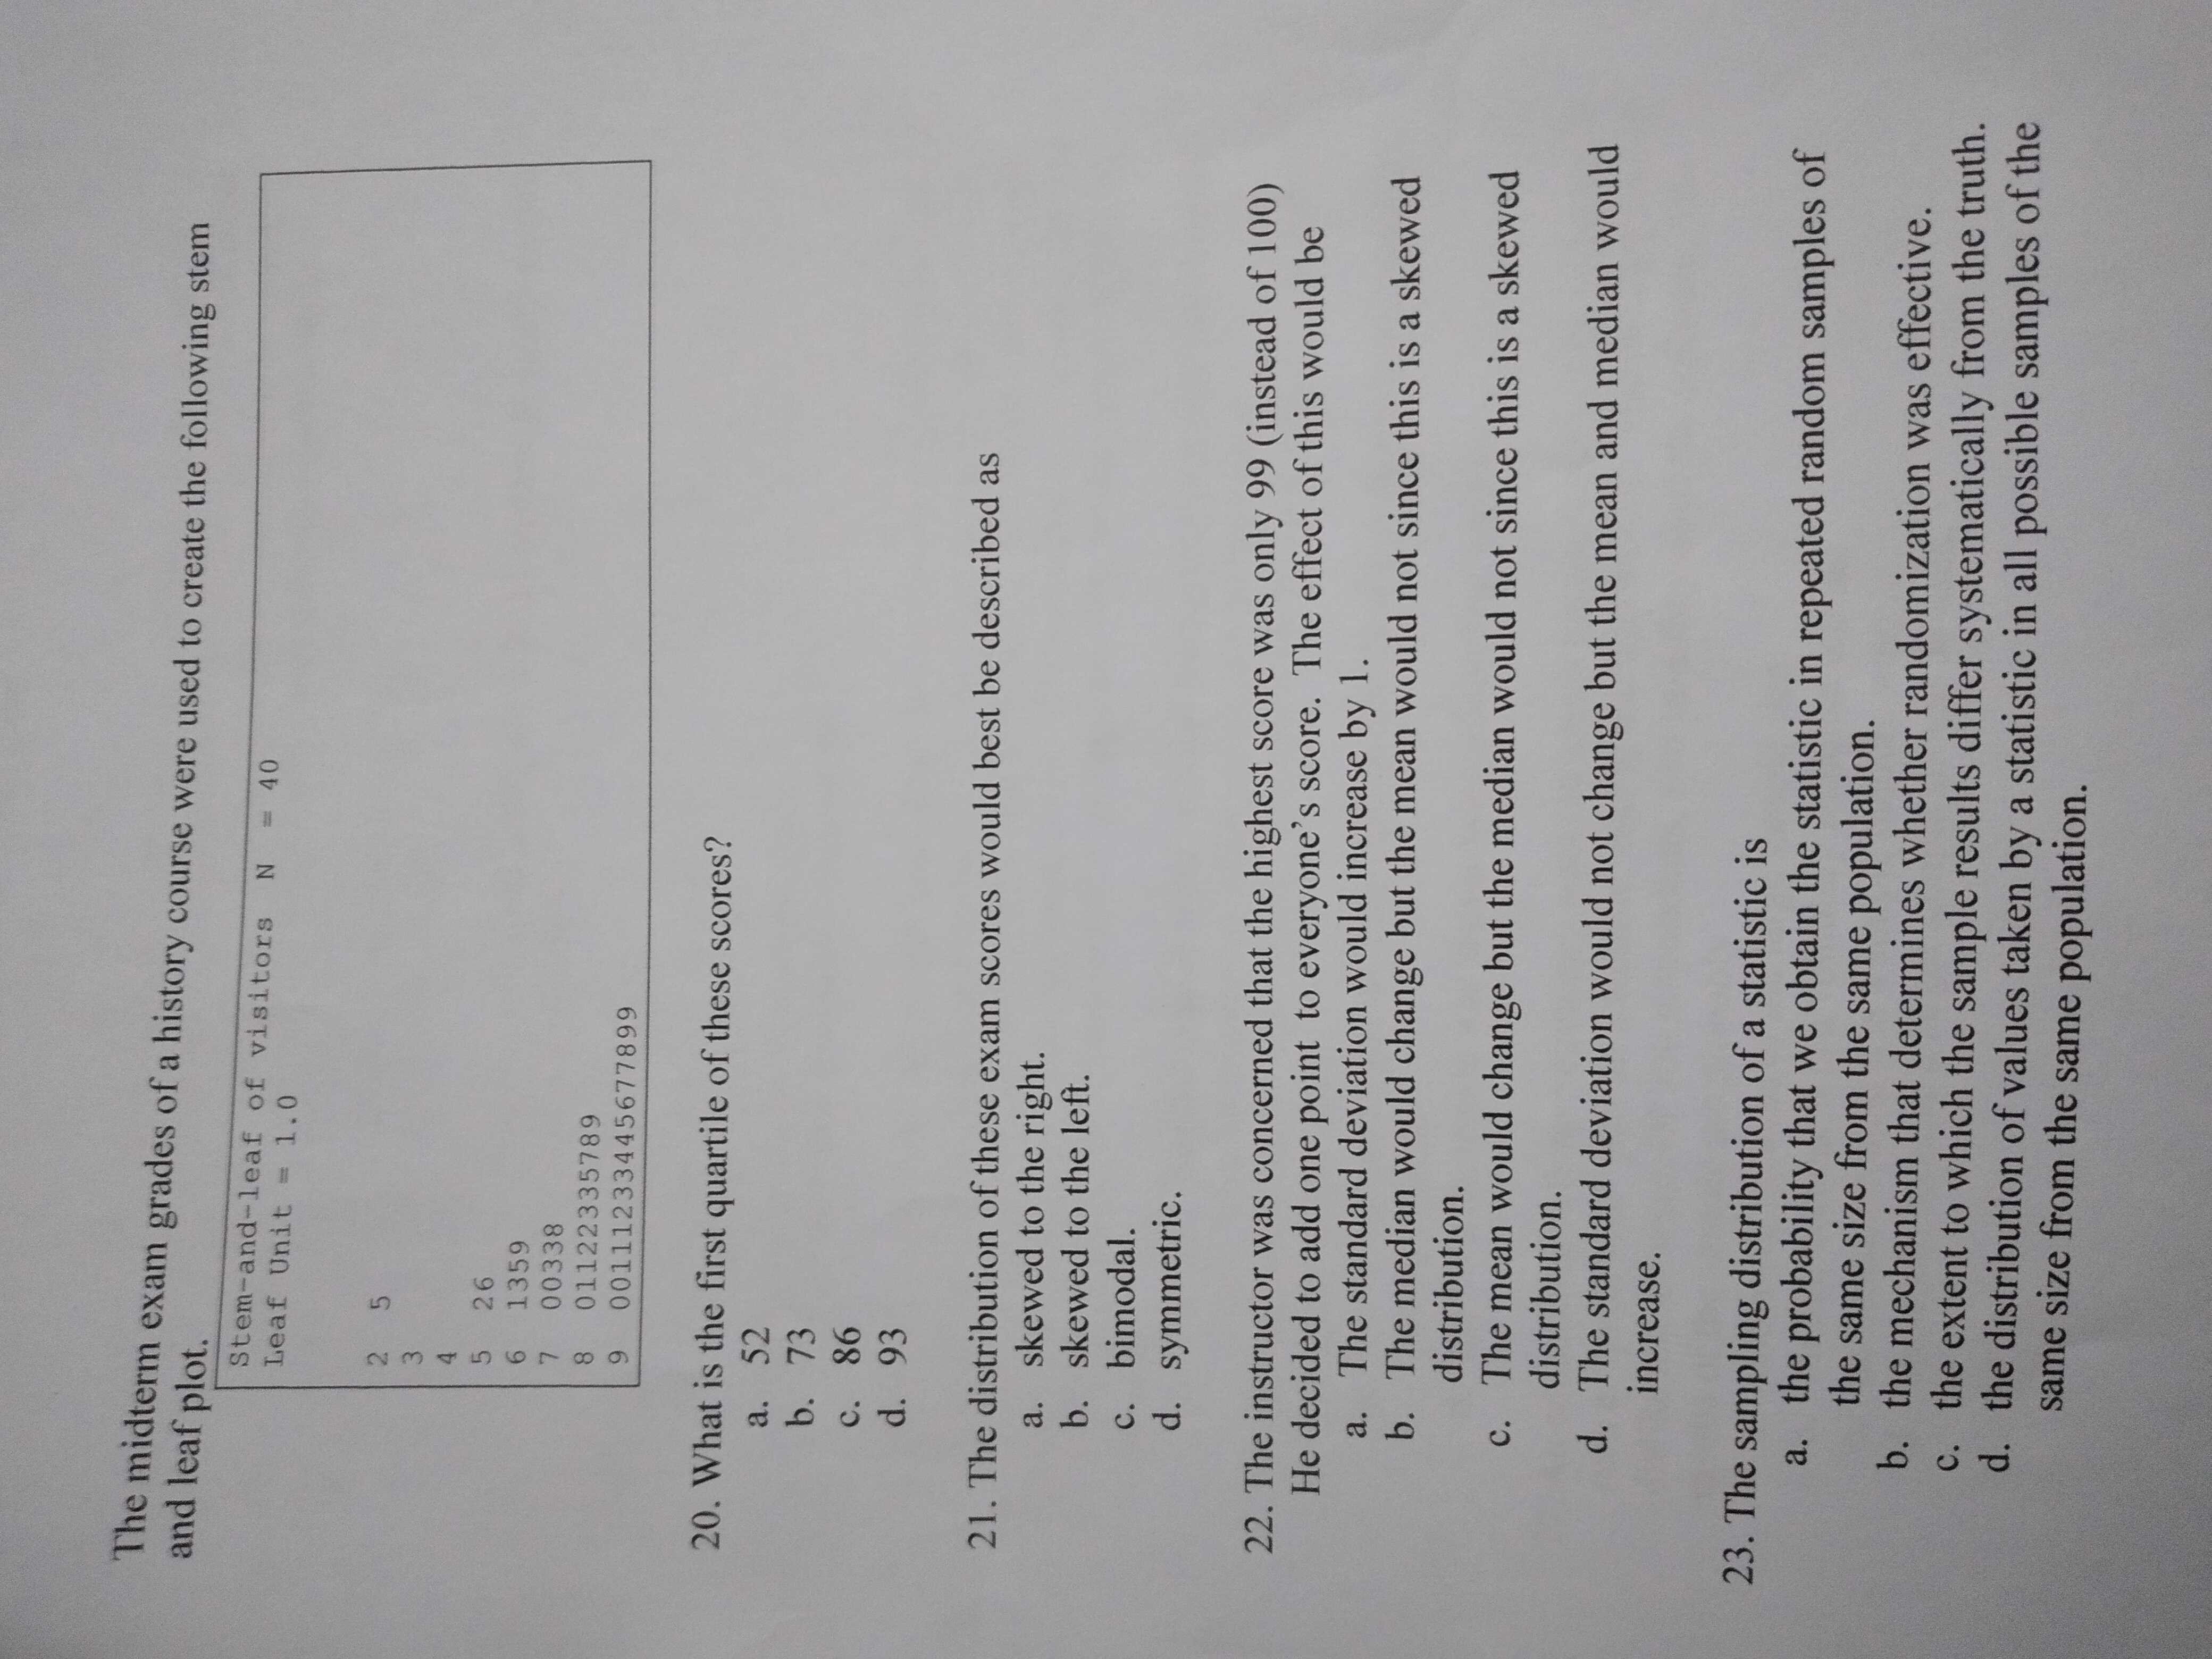
1. (5 points) Complete the Instructor and Class Time information on the cover sheet. True/False Multiple Choice CIRCLE the best answer (3 points each). 2. True False In a distribution that is right-skewed the mean will be greater than the median. 3 . True False A t-distribution is skewed to the right. 4. True False The p-value is the probability that the null hypothesis is correct. 5. True False A correlation is always between 0 and 1. 6. True False If a list of numbers has a mean of 0, then the standard deviation will also be zero. 7. True False A test statistic is used to measure the difference between the observed sample data and what is expected when the null hypothesis is true. 8. True False An outlier will typically fall between Q1 and Q3. 9. A student takes a standardized exam. The grader reports the student's standardized score (z-score) as -1.8. This indicates: a. The student scored lower than the average. b. The student scored less than one standard deviation from the average. c. A mistake has been made in calculating the score, since a standard score can never be negative. d. Both a and b, but not c. 10. A political scientist wants to know how college students feel about the social security system. She obtains a list of the 31 14 undergraduates at her college and mails a questionnaire to 250 students selected at random. Only 100 of the questionnaires are returned. In this study, the rate of non-response would be a. 0.25. b. 0.40. c. 0.75. d. 0.60. 1 1. The most important advantage of experiments over observational studies is that a. experiments are usually easier to carry out. b. experiments can give better evidence of causation. c. the placebo effect cannot happen in experiments. d. an observational study cannot have a response variable. 12. We use the t-distribution to calculate a confidence interval for the population mean u. If we increase the sample size from 10 to 20 the interval would become smaller because of a. the change in degrees of freedom. b. the change in standard error. c. both a and b. d. none of the above.The midterm exam grades of a history course were used to create the following stem and leaf plot. Stem-and-leaf of visitors N = 40 Leaf Unit = 1.0 5 5 26 6 00 - 1359 00338 01122335789 00111233445677899 20. What is the first quartile of these scores? 52 b . 73 C. 86 d. 93 21. The distribution of these exam scores would best be described as a. skewed to the right. b. skewed to the left. c. bimodal. d. symmetric. 22. The instructor was concerned that the highest score was only 99 (instead of 100) He decided to add one point to everyone's score. The effect of this would be a. The standard deviation would increase by 1. b. The median would change but the mean would not since this is a skewed distribution. c. The mean would change but the median would not since this is a skewed distribution. d. The standard deviation would not change but the mean and median would increase . 23. The sampling distribution of a statistic is a. the probability that we obtain the statistic in repeated random samples of the same size from the same population. b. the mechanism that determines whether randomization was effective. c. the extent to which the sample results differ systematically from the truth. d. the distribution of values taken by a statistic in all possible samples of the same size from the same population
Step by Step Solution
There are 3 Steps involved in it

Get step-by-step solutions from verified subject matter experts