

Question: Give Answer only for the circles below a) Exercise 1: What is the Gross Profit per Unit (dollars not %) for the XM1 drive using
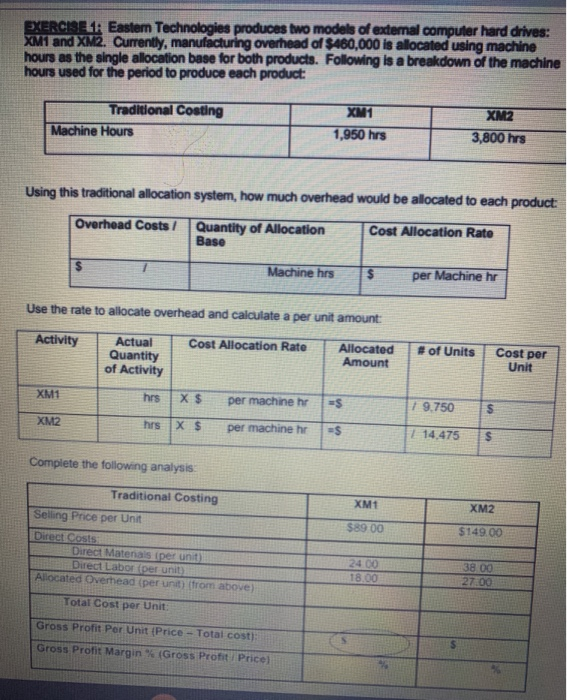
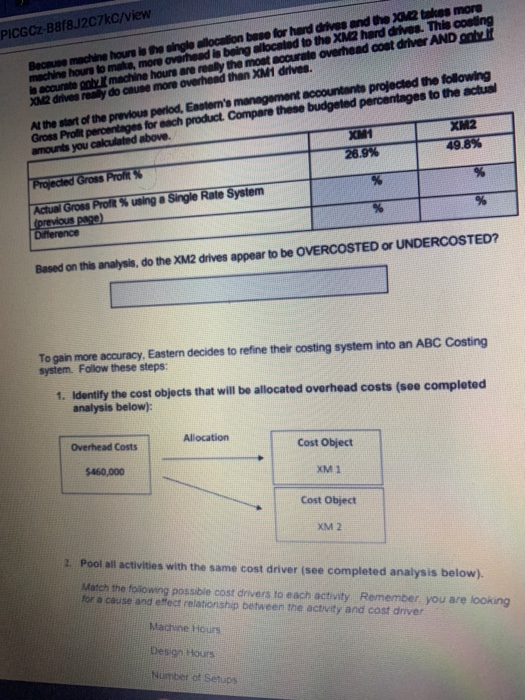
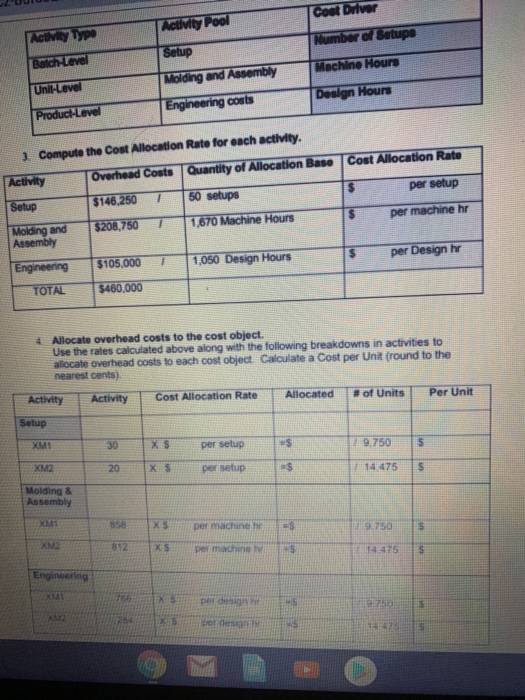
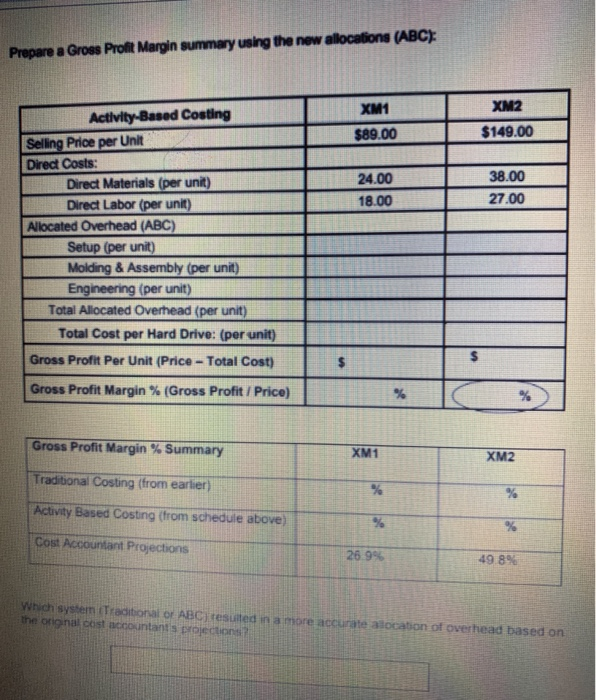
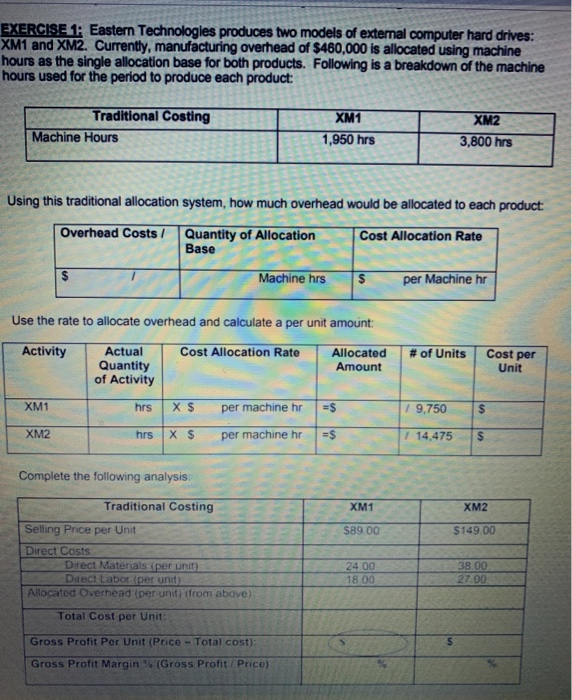
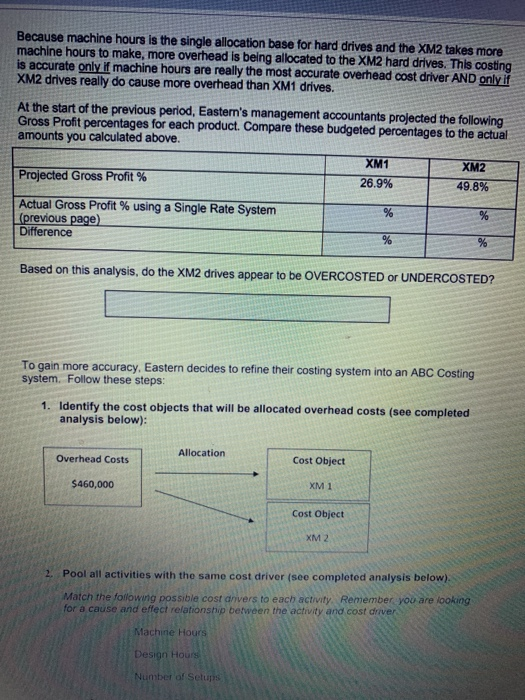
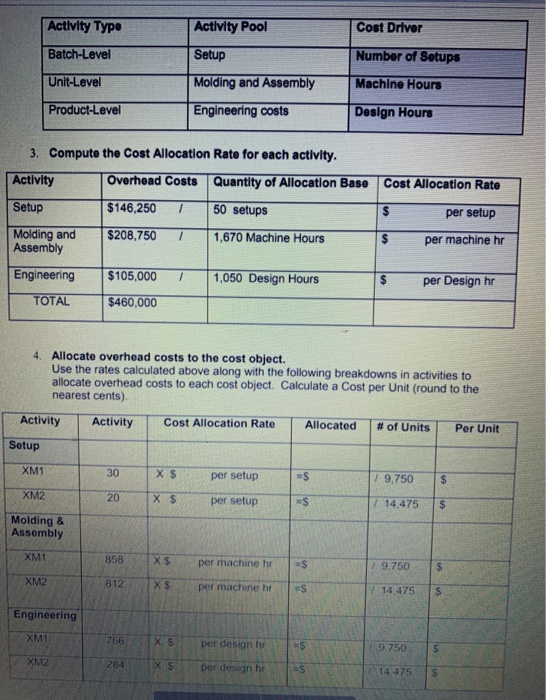
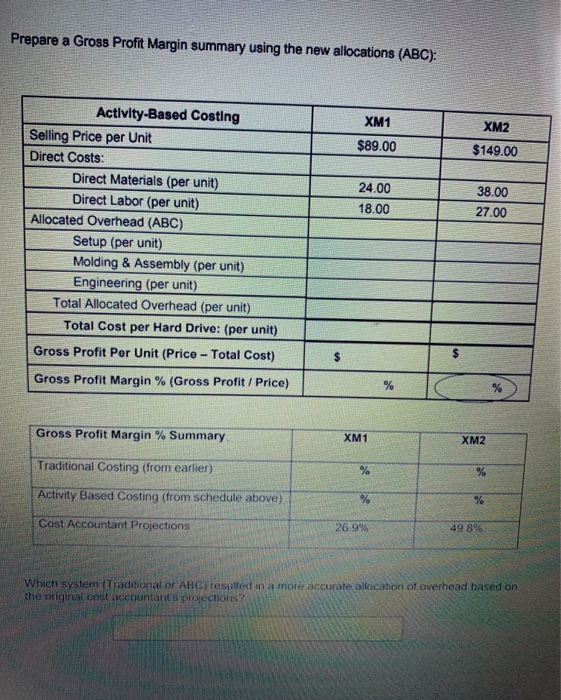
EXERCISELEastern Technologies produces two models of external computer hard drives: XM1 and XM2. Currently, manufacturing overhead of $460,000 is allocated using machine hours as the single allocation base for both products. Following is a breakdown of the machine hours used for the period to produce each product: Traditional Costing Machine Hours XM1 1,950 hrs XM2 3,800 hrs Using this traditional allocation system, how much overhead would be allocated to each product: Overhead Costs 7 Quantity of Allocation Base Cost Allocation Rato Machine hrs $ per Machine hr Use the rate to allocate overhead and calculate a per unit amount: Activity Cost Allocation Rate Actual Quantity of Activity Allocated Amount # of Units Cost per Unit XM1 hrs X $ per machine hr =$ 19.750 $ XM2 hrs X $ per machine hr $ =$ | 14.475 Complete the following analysis XMt XM2 $89.00 $149.00 Traditional Costing Selling Price per Unit Direct Costs Direct Matenals per unit Direct Labor per unit Allocated Overhead (per unit (from above) Total Cost per Unit 24.00 18.00 38 00 27.00 Gross Profit Por Unit (Price - Total cost); Gross Profit Margin (Gross Profit Price PICGCZ-Baf8J2C7kc/view Because machine hours is the single allocation beso for hard drives and the X2 takes more machine hours to make more overhead is being allocated to the XM2 hard drives. This conting In accurately machine hours are really the most accurate overhead coat driver AND only XM drives remy do cause more overhead than XM drives Al the start of the previous period. Eastern's management accountants projected the following Gross Prolt percentages for each product. Compare these budgeted percentages to the actual amounts you calculated above Xum XM2 Projected Gross Profit 26.9% 49.8% Actual Grous Proft % using a Single Rate System previous page) Dinerence Based on this analysis, do the XM2 drives appear to be OVERCOSTED or UNDERCOSTED? To gain more accuracy, Eastern decides to refine their costing system into an ABC Costing system. Follow these steps: 1. Identify the cost objects that will be allocated overhead costs (see completed analysis below): Allocation Overhead Costs Cost Object $460,000 XM1 Cost Object XM 2 2. Pool all activities with the same cost driver (see completed analysis below). Match the following possible cost drivers to each activity Remember you are looking for a cause and effect relationship between the activity and cost driver Machine Hours Design Hours Number of Setup Coat Divor Activity Pool ACUM Type Number of Setup Setup Batch Level Machine Hours Unilevel Molding and Assembly Engineering costs Design Hours Product Level Cost Allocation Rate per setup 1 Compute the Cost Allocation Rate for each activity, Activity Overhead Costs Quantity of Allocation Base Setup $146.250 1 50 setups Molding and $206,750 7 1.670 Machine Hours Assembly $ per machine hr $ per Design by Engineering $105.000 1 1,050 Design Hours TOTAL $460.000 4 Allocate overhead costs to the cost object. Use the rates Calculated above along with the following breakdowns in activities to allocate overhead costs to each cost object. Calculate a Cost per Unit (round to the nearest cents) Allocated Cost Allocation Rate #of Units Activity Per Unit Activity Setup XMI 30 XS per setup -$ 19.750 5 XMZ 20 Xs per setup $ 14 475 S Molding & Assembly 858 XS per machine ES 9.750 5 892 XS per machine 14.475 S Engineering XML 18 EX per deg 95 X $ por de 142 Prepare a Gross Profit Margin summary using the new allocations (ABC): XM1 $89.00 XM2 $149.00 24.00 18.00 38.00 27.00 Activity-Based Costing Selling Price per Unit Direct Costs: Direct Materials (per unit) Direct Labor (per unit) Allocated Overhead (ABC) Setup (per unit) Molding & Assembly (per unit) Engineering (per unit) Total Allocated Overhead (per unit) Total Cost per Hard Drive: (per unit) Gross Profit Per Unit (Price - Total Cost) $ Gross Profit Margin % (Gross Profit / Price) % Gross Profit Margin % Summary XM1 XM2 Traditional Costing (from earlier) Activity Based Costing (from schedule above) Cost Accountant Projections 26.9% 49.8% Which system Traditional or ABC) resulted in a more accurate alocation of overhead based on the original cost accountant projections EXERCISE 1: Eastern Technologies produces two models of external computer hard drives: XM1 and XM2. Currently, manufacturing overhead of $460,000 is allocated using machine hours as the single allocation base for both products. Following is a breakdown of the machine hours used for the period to produce each product: Traditional Costing Machine Hours XM1 1,950 hrs XM2 3,800 hrs Using this traditional allocation system, how much overhead would be allocated to each product: Overhead Costs/ Quantity of Allocation Base Cost Allocation Rate Machine hrs $ per Machine hr Use the rate to allocate overhead and calculate a per unit amount: Activity Cost Allocation Rate Actual Quantity of Activity Allocated Amount # of Units Cost per Unit XM1 hrs X$ per machine hr =$ 1 9.750 S XM2 hrs X $ per machine hr =$ 1 14.475 $ Complete the following analysis Traditional Costing XM1 XM2 $89.00 $149 00 Selling Price per Unit Direct Costs Direct Materials per unit Ditect Labor (per unit) Allocated Overhead (per unit) (from above) 24 00 18.00 38.00 27.00 Total Cost per Unit: Gross Profit Per Unit (Price - Total cost): Gross Profit Margin % (Gross Profit Price) Because machine hours is the single allocation base for hard drives and the XM2 takes more machine hours to make, more overhead is being allocated to the XM2 hard drives. This costing is accurate only if machine hours are really the most accurate overhead cost driver AND only if XM2 drives really do cause more overhead than XM1 drives. At the start of the previous period, Eastern's management accountants projected the following Gross Profit percentages for each product. Compare these budgeted percentages to the actual amounts you calculated above. XM1 XM2 Projected Gross Profit % 26.9% 49.8% Actual Gross Profit % using a Single Rate System % (previous page) Difference % % Based on this analysis, do the XM2 drives appear to be OVERCOSTED or UNDERCOSTED? To gain more accuracy, Eastern decides to refine their costing system into an ABC Costing system. Follow these steps: 1. Identify the cost objects that will be allocated overhead costs (see completed analysis below): Overhead Costs Allocation Cost Object $460,000 XM1 Cost Object XM2 2. Pool all activities with the same cost driver (see completed analysis below) Match the following possible cost drivers to each activity. Remember you are looking for a cause and effect relationship between the activity and cost driver Machine Hours Design Hours Number of Selupis Activity Type Activity Pool Cost Driver Batch-Level Setup Number of Setups Unit-Level Molding and Assembly Machine Hours Product-Level Engineering costs Design Hours 3. Compute the Cost Allocation Rate for each activity. Activity Overhead Costs Quantity of Allocation Base Cost Allocation Rate $146,250 1 50 setups $ per setup Setup Molding and Assembly $208,750 1 1,670 Machine Hours $ per machine hr Engineering $105,000 1 1,050 Design Hours $ per Design hr TOTAL $460,000 4. Allocate overhead costs to the cost object. Use the rates calculated above along with the following breakdowns in activities to allocate overhead costs to each cost object. Calculate a Cost per Unit (round to the nearest cents). Activity Activity Cost Allocation Rate Allocated # of Units Per Unit Setup XM1 30 X $ per setup =$ 7 9.750 $ XM2 20 X $ per setup =$ 1 14,475 $ Molding & Assembly XM1 858 X$ per machine hr s 9.750 XM2 812 X$ per machine hr -S 114,475 $ Engineering XM1 766 XS per design hi ES 9.750 $ XM2 284 XS per design hr al 14.475 $ Prepare a Gross Profit Margin summary using the new allocations (ABC): XM1 $89.00 XM2 $149.00 24.00 18.00 38.00 27.00 Activity-Based Costing Selling Price per Unit Direct Costs: Direct Materials (per unit) Direct Labor (per unit) Allocated Overhead (ABC) Setup (per unit) Molding & Assembly (per unit) Engineering (per unit) Total Allocated Overhead (per unit) Total Cost per Hard Drive: (per unit) Gross Profit Per Unit (Price - Total Cost) $ Gross Profit Margin % (Gross Profit / Price) % % Gross Profit Margin % Summary XM1 XM2 Traditional Costing (from earlier) % % Activity Based Costing (from schedule above) % % Cost Accountant Projections 26.9% 49.8% Which system (Traditional or ABC) resulted in a more accurate allocation of overhead based on the original cost accountant projections
Step by Step Solution
There are 3 Steps involved in it

Get step-by-step solutions from verified subject matter experts