

Question: give correct answer and explain it Year Real GDP Potential GDP (trillions of $) (trillions of $) 1995 3.20 3.30 1996 3.45 3.65 1997 3.75
give correct answer and explain it
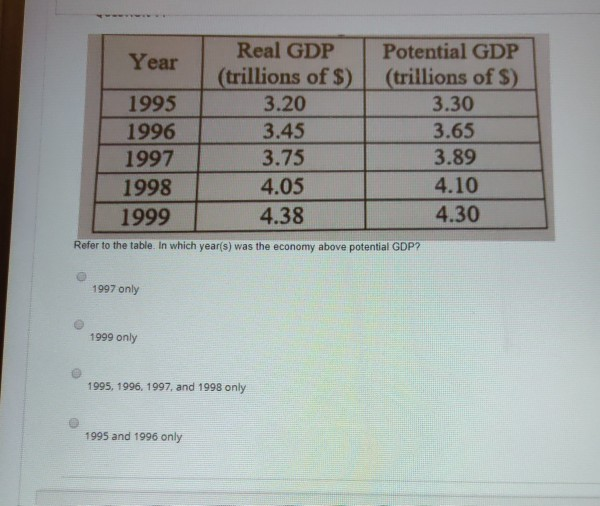
Year Real GDP Potential GDP (trillions of $) (trillions of $) 1995 3.20 3.30 1996 3.45 3.65 1997 3.75 3.89 1998 4.05 4.10 1999 4.38 4.30 Refer to the table. In which year(s) was the economy above potential GDP? 1997 only 1999 only 1995, 1996, 1997, and 1998 only 1995 and 1996 only
Step by Step Solution
There are 3 Steps involved in it
1 Expert Approved Answer
Step: 1 Unlock

Question Has Been Solved by an Expert!
Get step-by-step solutions from verified subject matter experts
Step: 2 Unlock
Step: 3 Unlock