

Question: Give MATLAB commands to plot, on the same figure, the two functions: f=31+21-0.5 g= 2t cos(t) Where the variable t varies from 0 to
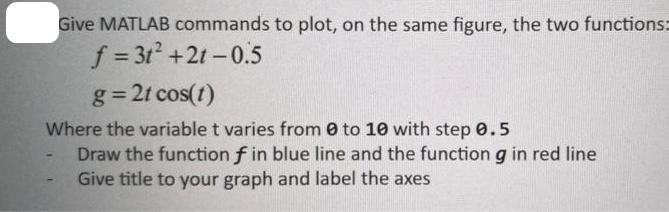
Give MATLAB commands to plot, on the same figure, the two functions: f=31+21-0.5 g= 2t cos(t) Where the variable t varies from 0 to 10 with step 0.5 Draw the function f in blue line and the function g in red line Give title to your graph and label the axes
Step by Step Solution
There are 3 Steps involved in it
1 Expert Approved Answer
Step: 1 Unlock

Question Has Been Solved by an Expert!
Get step-by-step solutions from verified subject matter experts
Step: 2 Unlock
Step: 3 Unlock