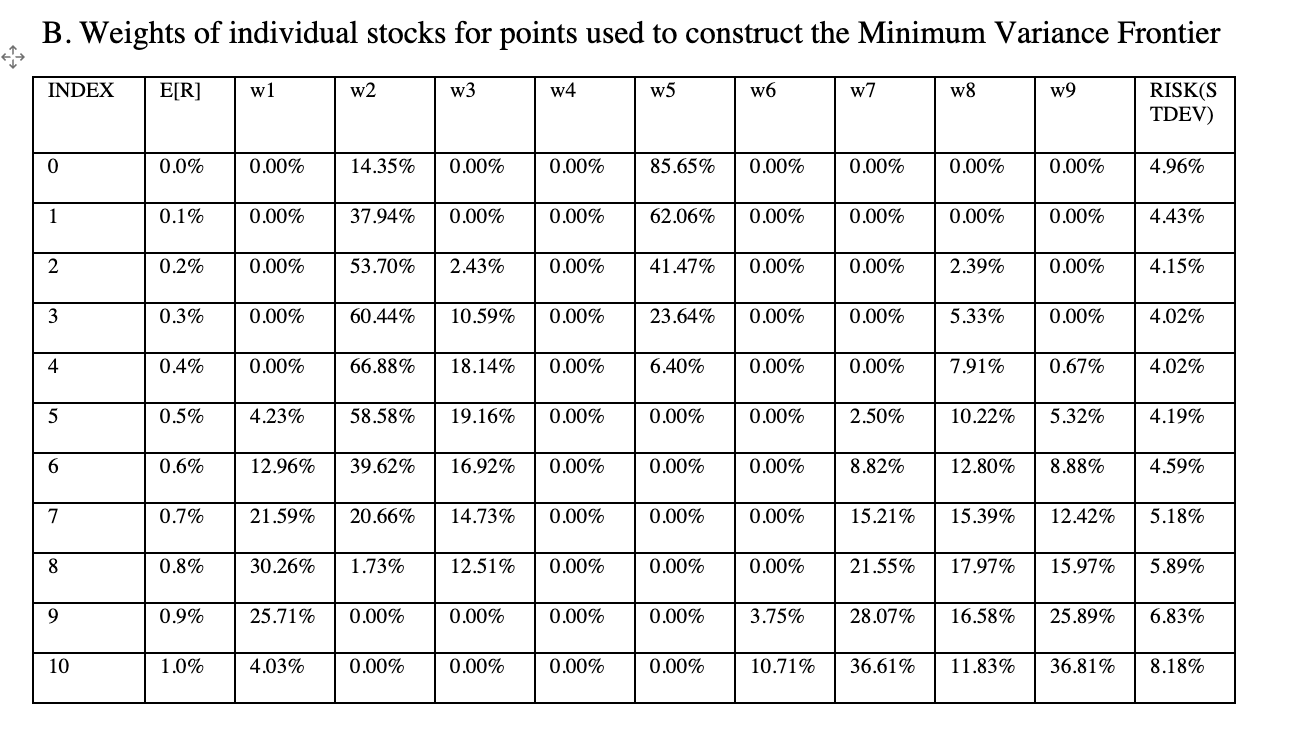
Question: give me a short description for this graph B. Weights of individual stocks for points used to construct the Minimum Variance Frontier INDEX E[R] w1

give me a short description for this graph

give me a short description for this graph B.
B. Weights of individual stocks for points used to construct the Minimum Variance Frontier INDEX E[R] w1 w2 w3 w4 w5 w6 w7 w8 w9 RISK(S TDEV) 0 0.0% 0.00% 14.35% 0.00% 0.00% 85.65% 0.00% 0.00% 0.00% 0.00% 4.96% 0.1% 0.00% 37.94% 0.00% 0.00% 62.06% 0.00% 0.00% 0.00% 0.00% 4.43% 2 0.2% 0.00% 53.70% 2.43% 0.00% 41.47% 0.00% 0.00% 2.39% 0.00% 4.15% 3 0.3% 0.00% 60.44% 10.59% 0.00% 23.64% 0.00% 0.00% 5.33% 0.00% 4.02% 4 0.4% 0.00% 66.88% 18.14% 0.00% 6.40% 0.00% 0.00% 7.91% 0.67% 4.02% 5 0.5% 4.23% 58.58% 19.16% 0.00% 0.00% 0.00% 2.50% 10.22% 5.32% 4.19% 6 0.6% 12.96% 39.62% 16.92% 0.00% 0.00% 0.00% 8.82% 12.80% 8.88% 4.59% 7 0.7% 21.59% 20.66% 14.73% 0.00% 0.00% 0.00% 15.21% 15.39% 12.42% 5.18% 8 0.8% 30.26% 1.73% 12.51% 0.00% 0.00% 0.00% 21.55% 17.97% 15.97% 5.89% 9 0.9% 25.71% 0.00% 0.00% 0.00% 0.00% 3.75% 28.07% 16.58% 25.89% 6.83% 10 1.0% 4.03% 0.00% 0.00% 0.00% 0.00% 10.71% 36.61% 11.83% 36.81% 8.18%

Step by Step Solution

There are 3 Steps involved in it

1 Expert Approved Answer
Step: 1 Unlock blur-text-image
Question Has Been Solved by an Expert!

Get step-by-step solutions from verified subject matter experts

Step: 2 Unlock
Step: 3 Unlock

Students Have Also Explored These Related Mathematics Questions!