

Question: give me all the steps 4..EOC72 ' Question Help 7 a A graduate class has 13 students with A grades and 15 students with B
give me all the steps
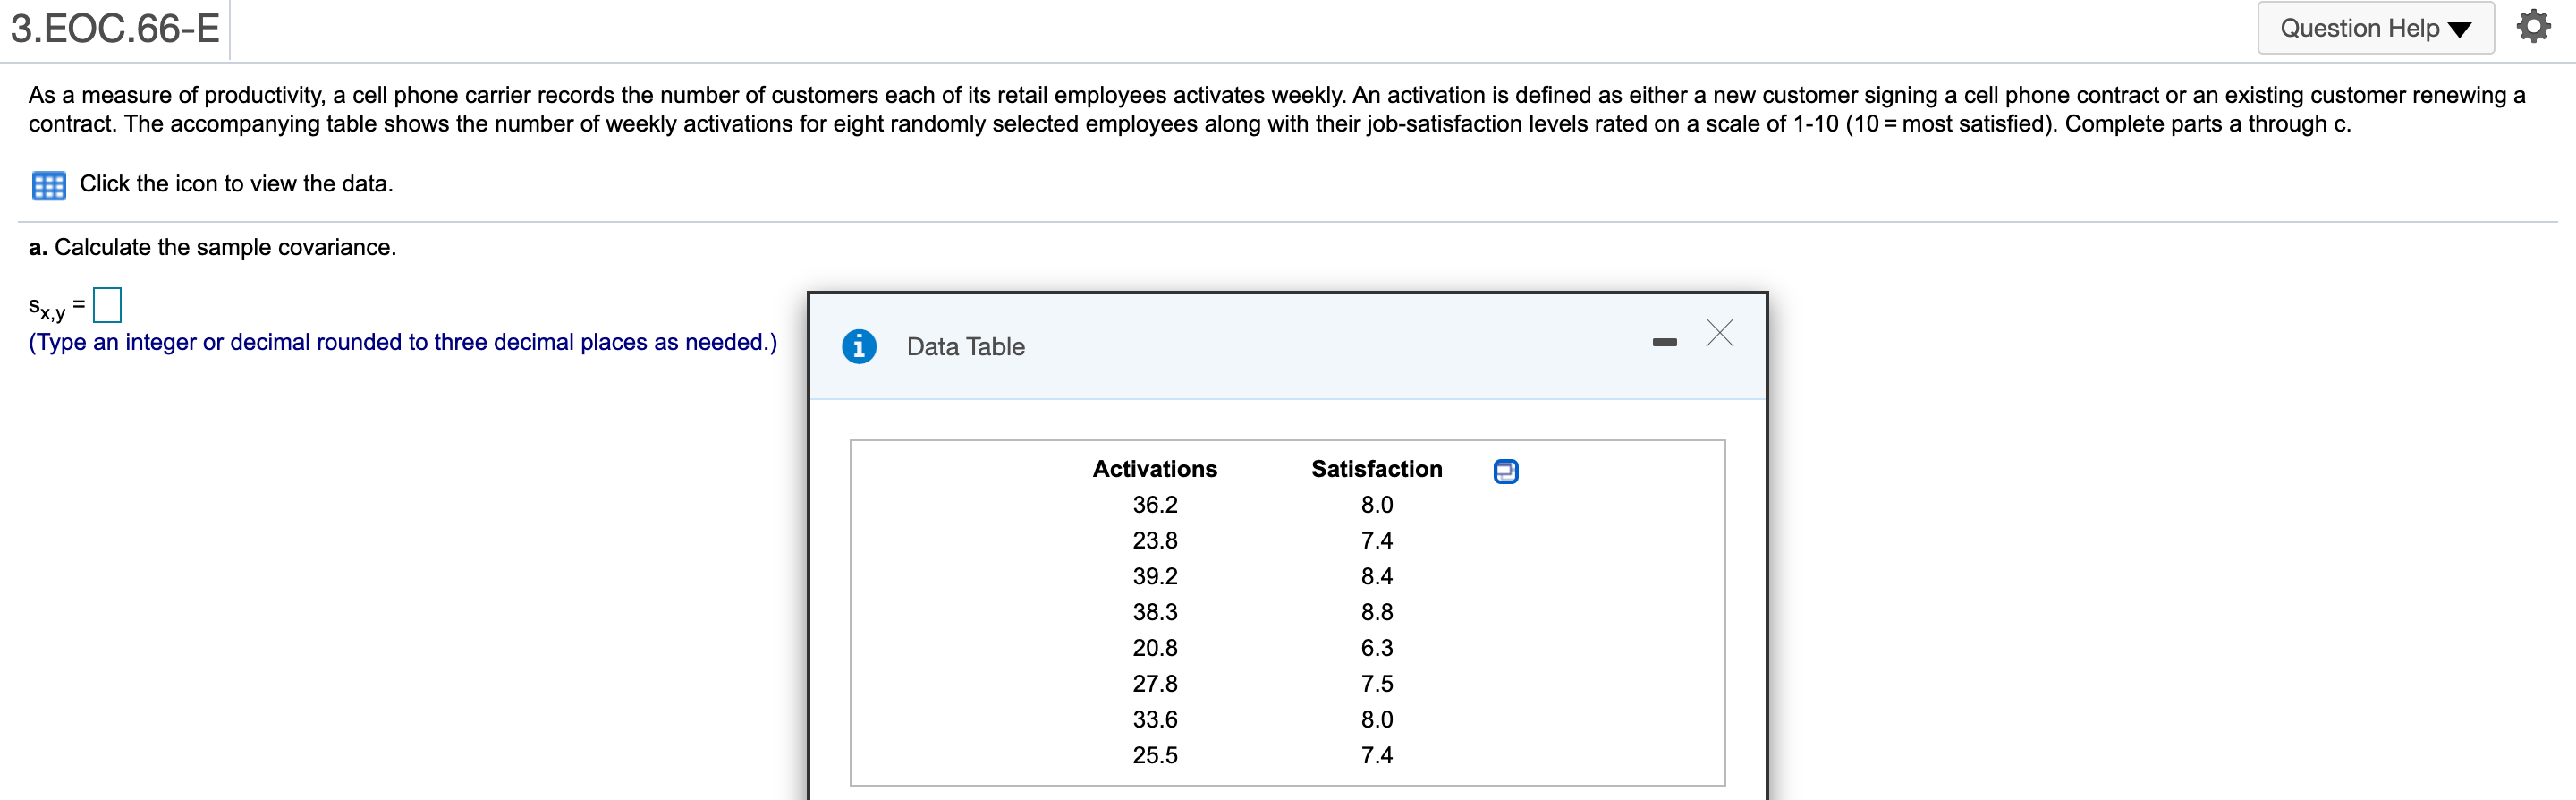
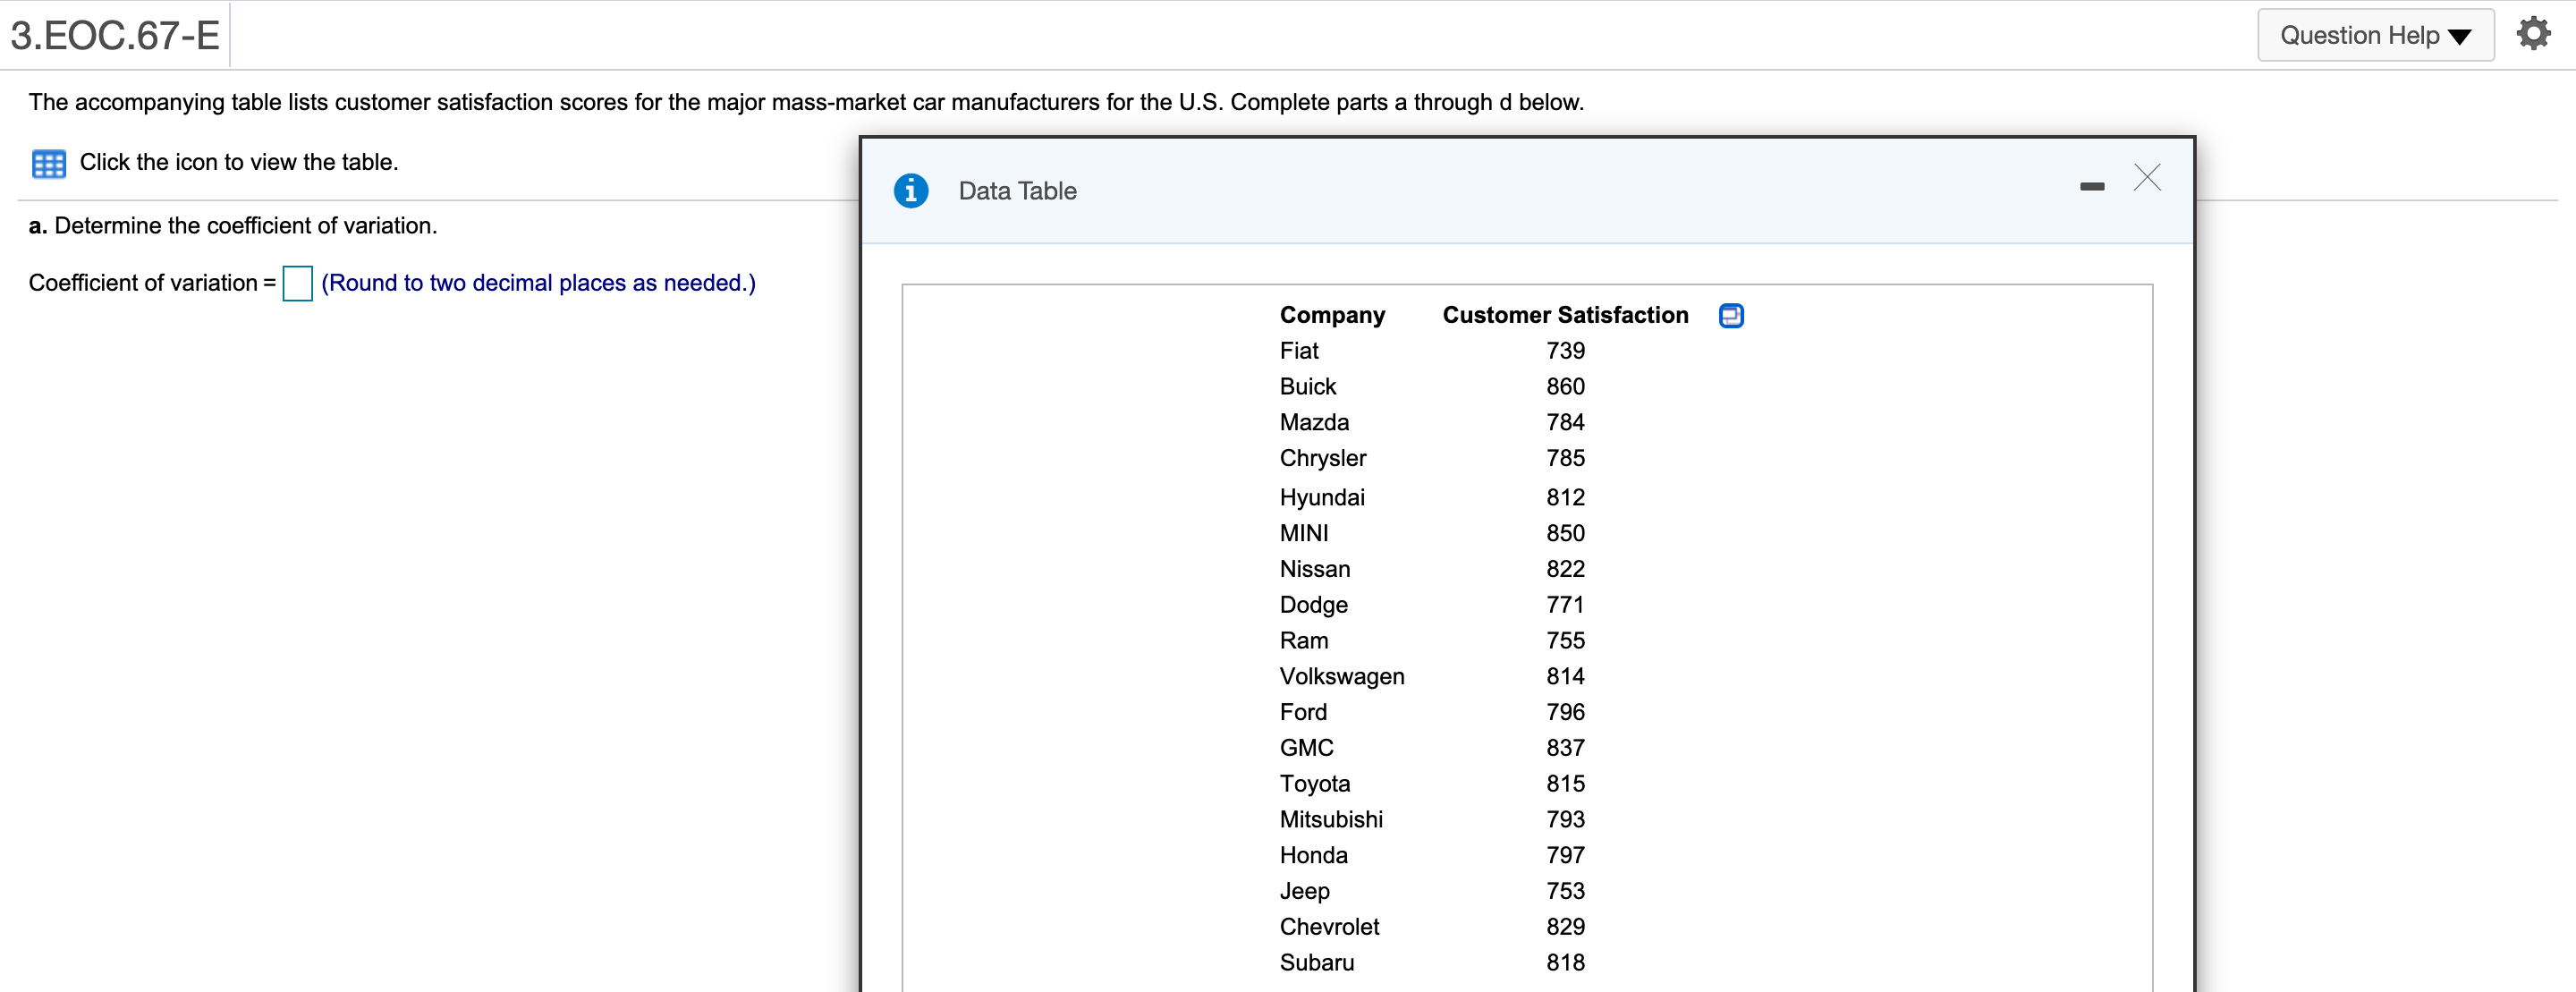
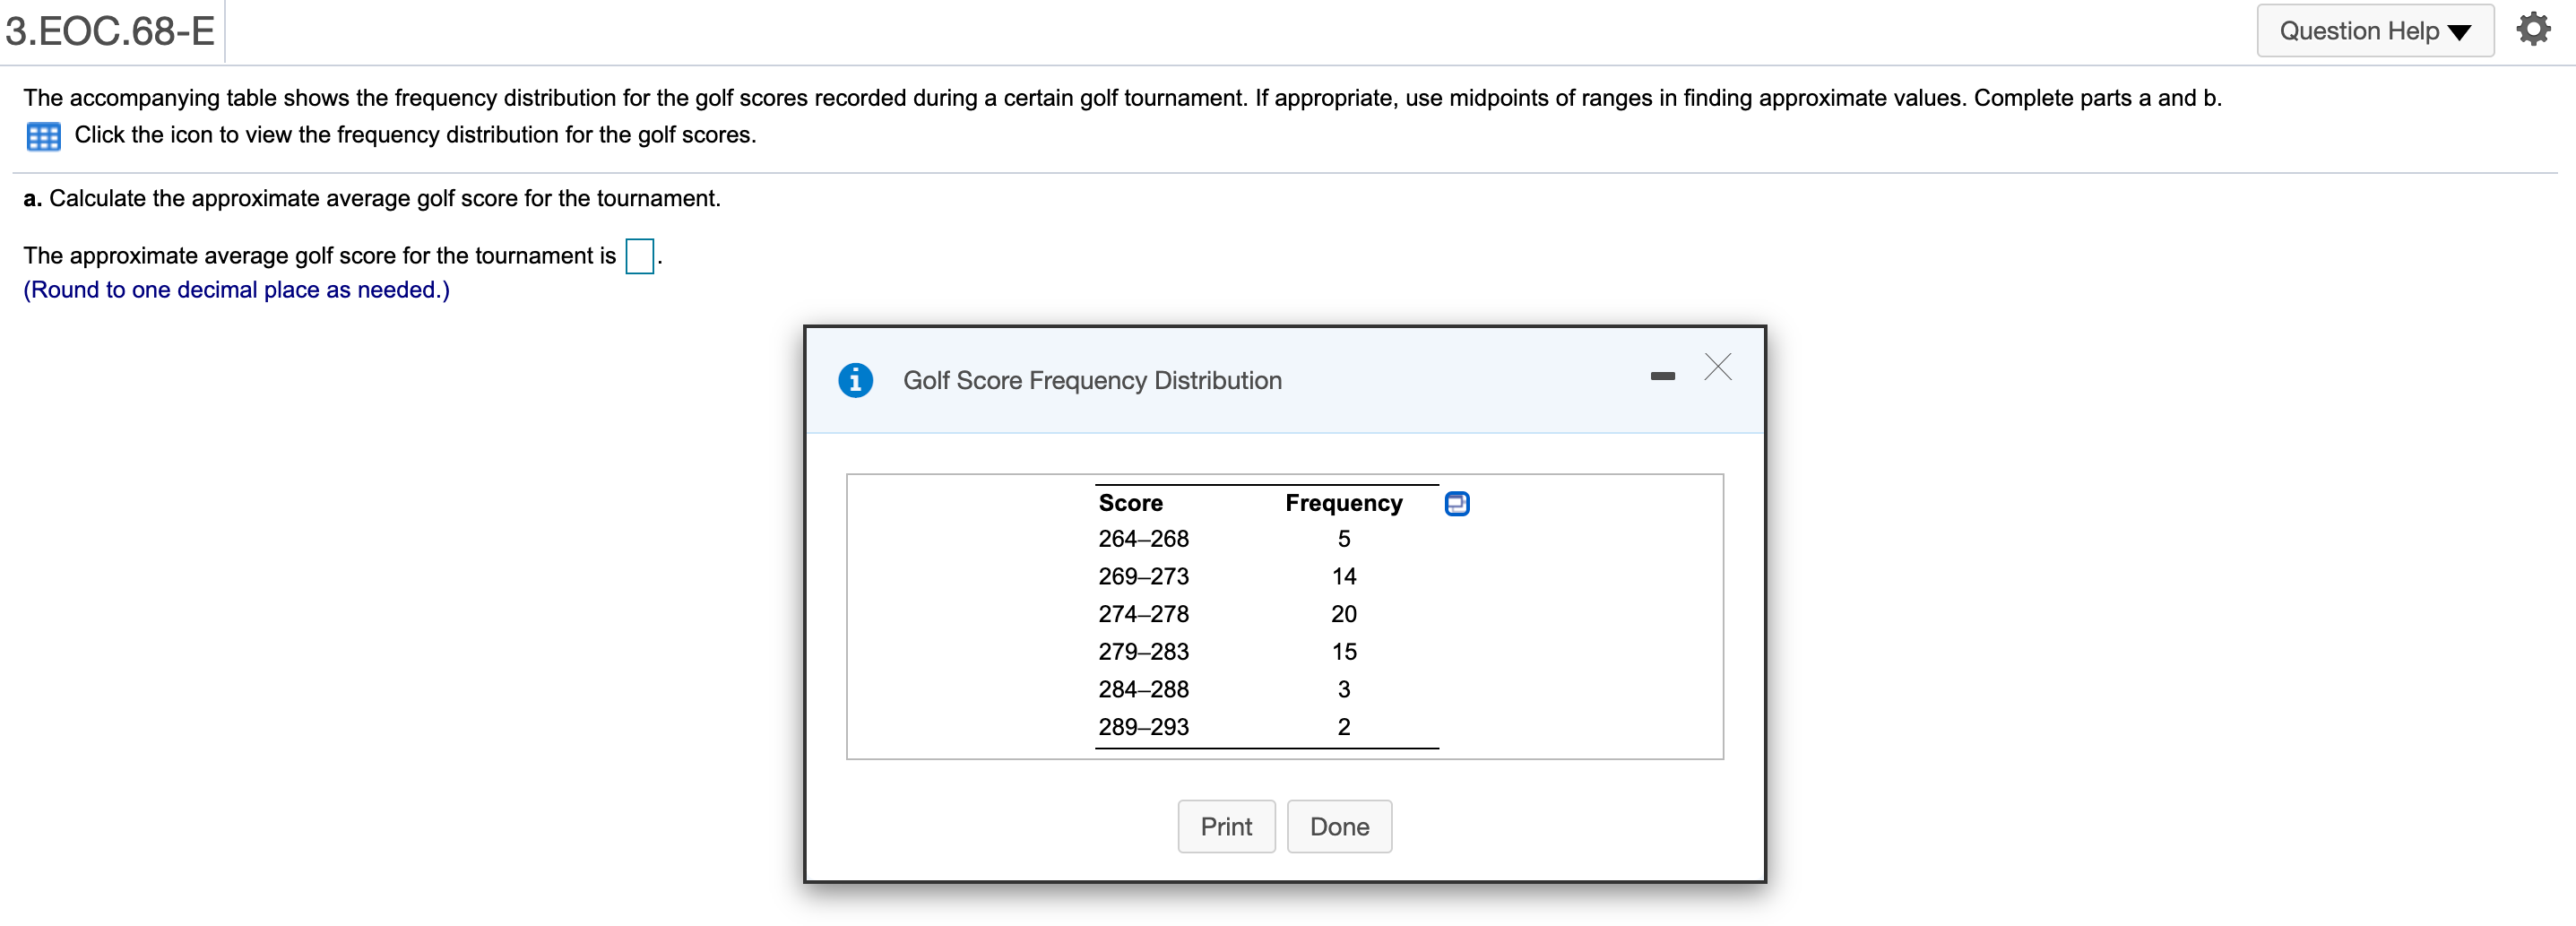
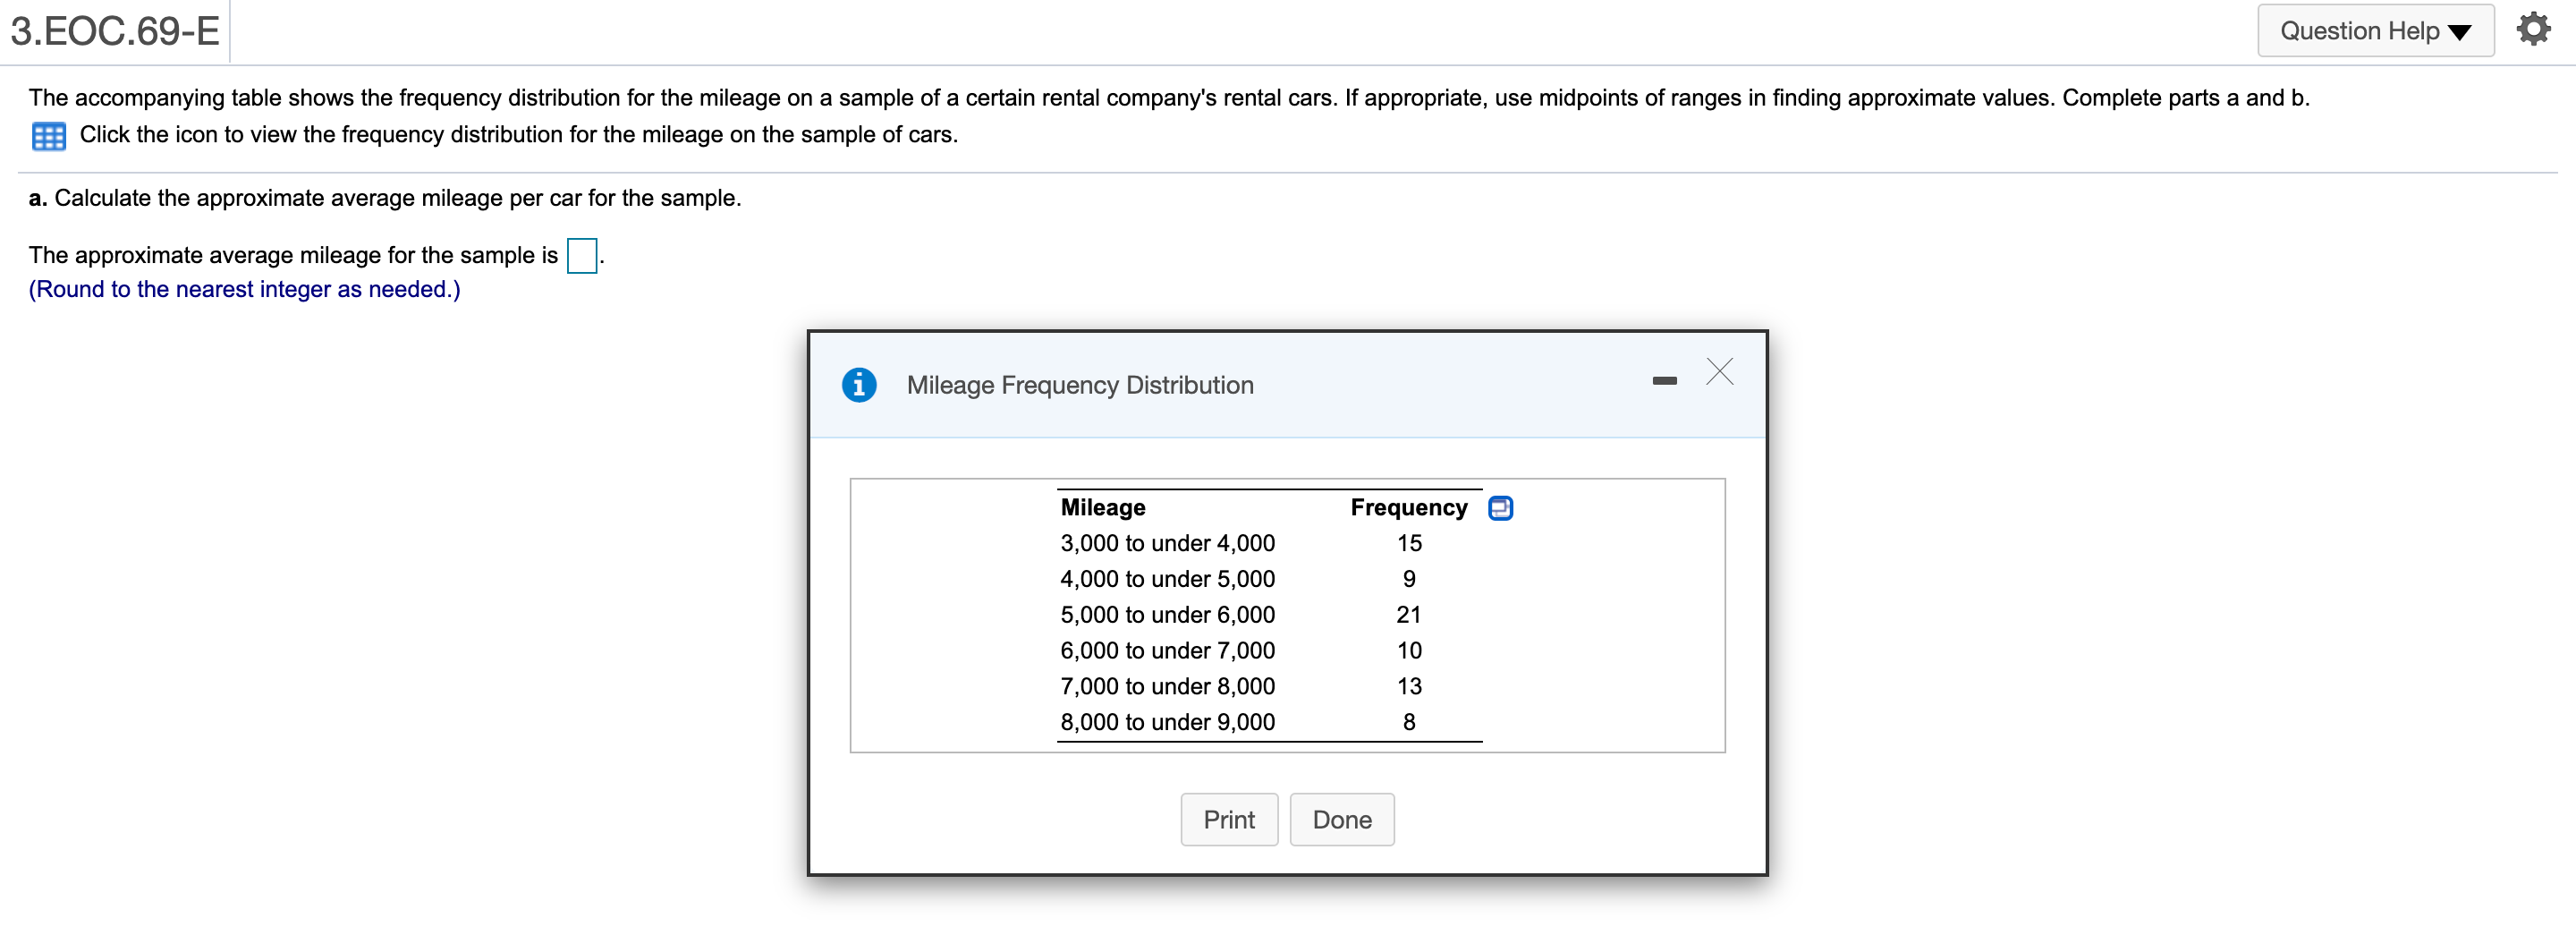
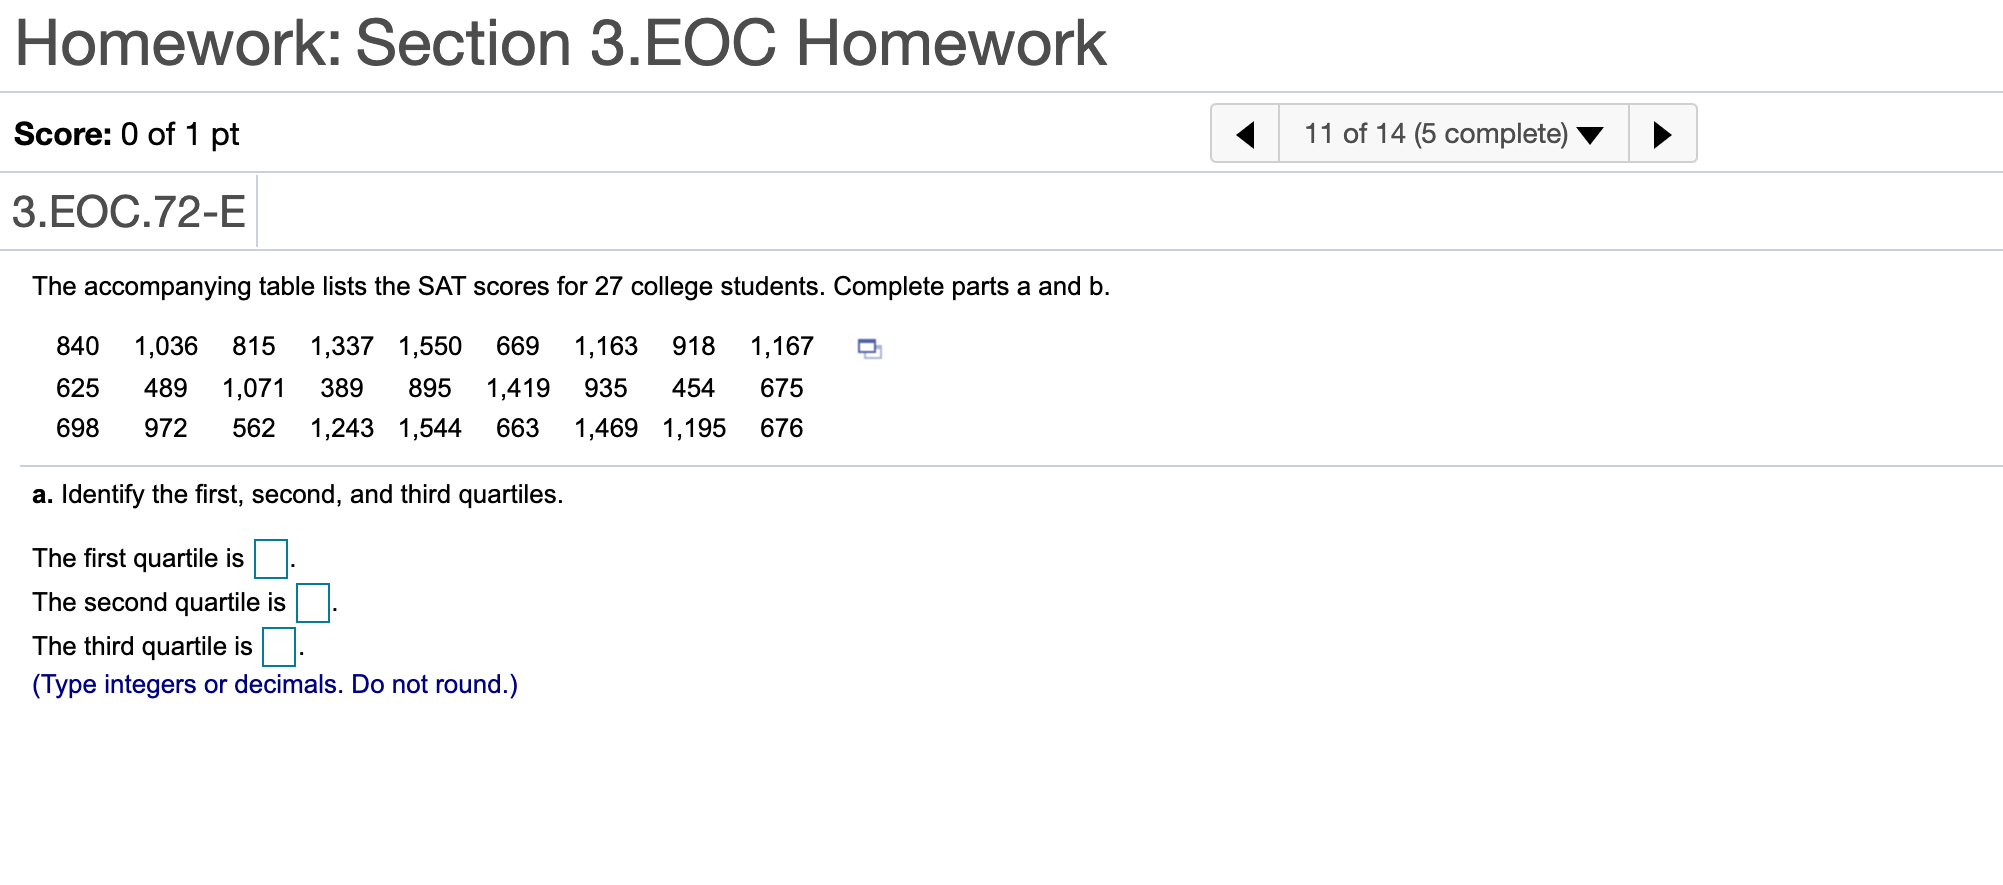
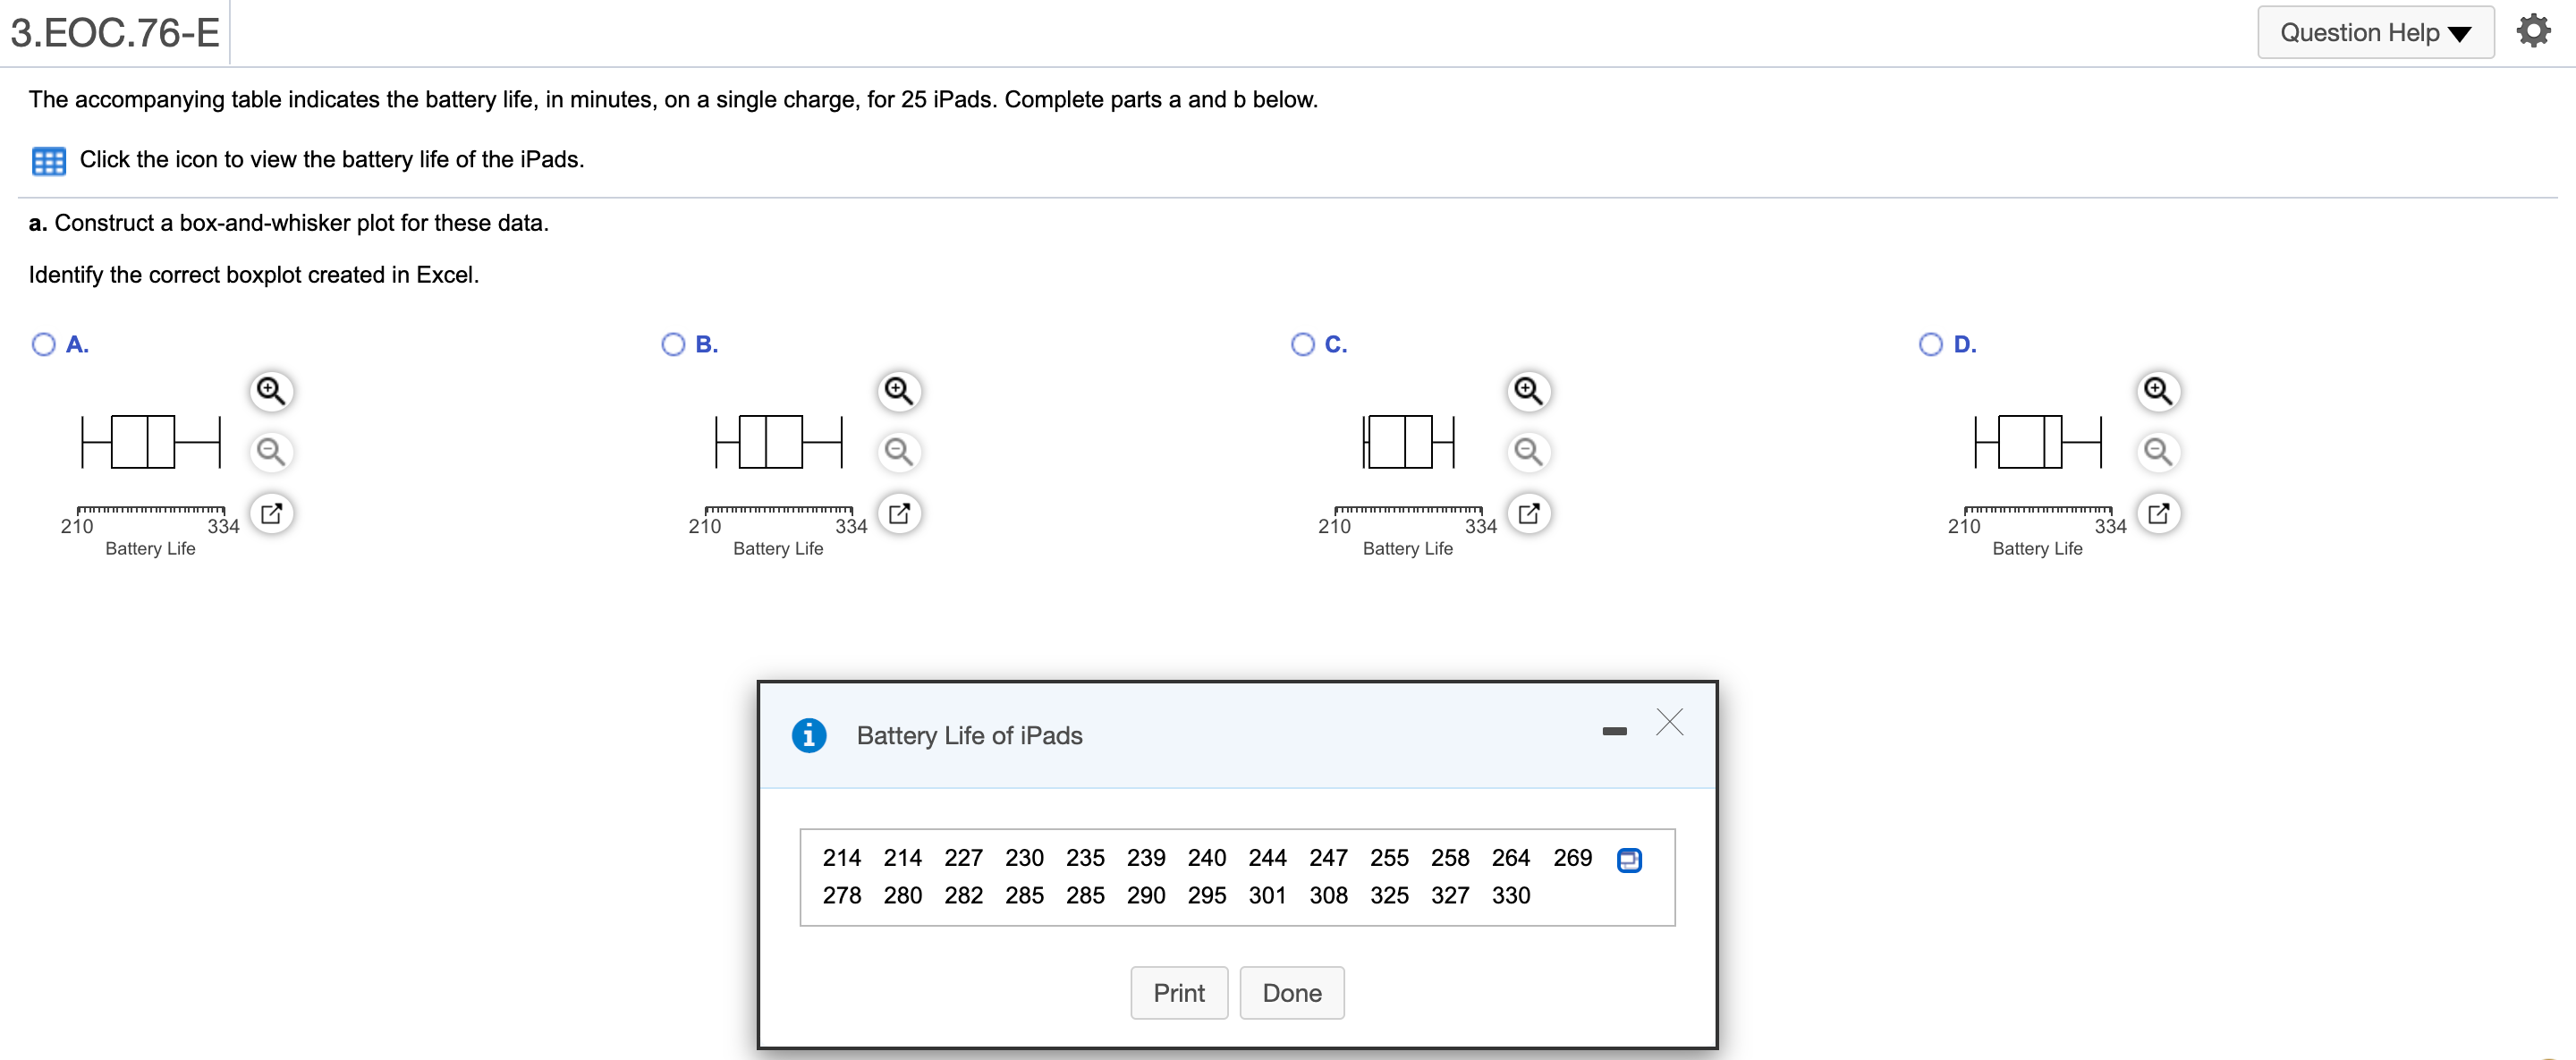
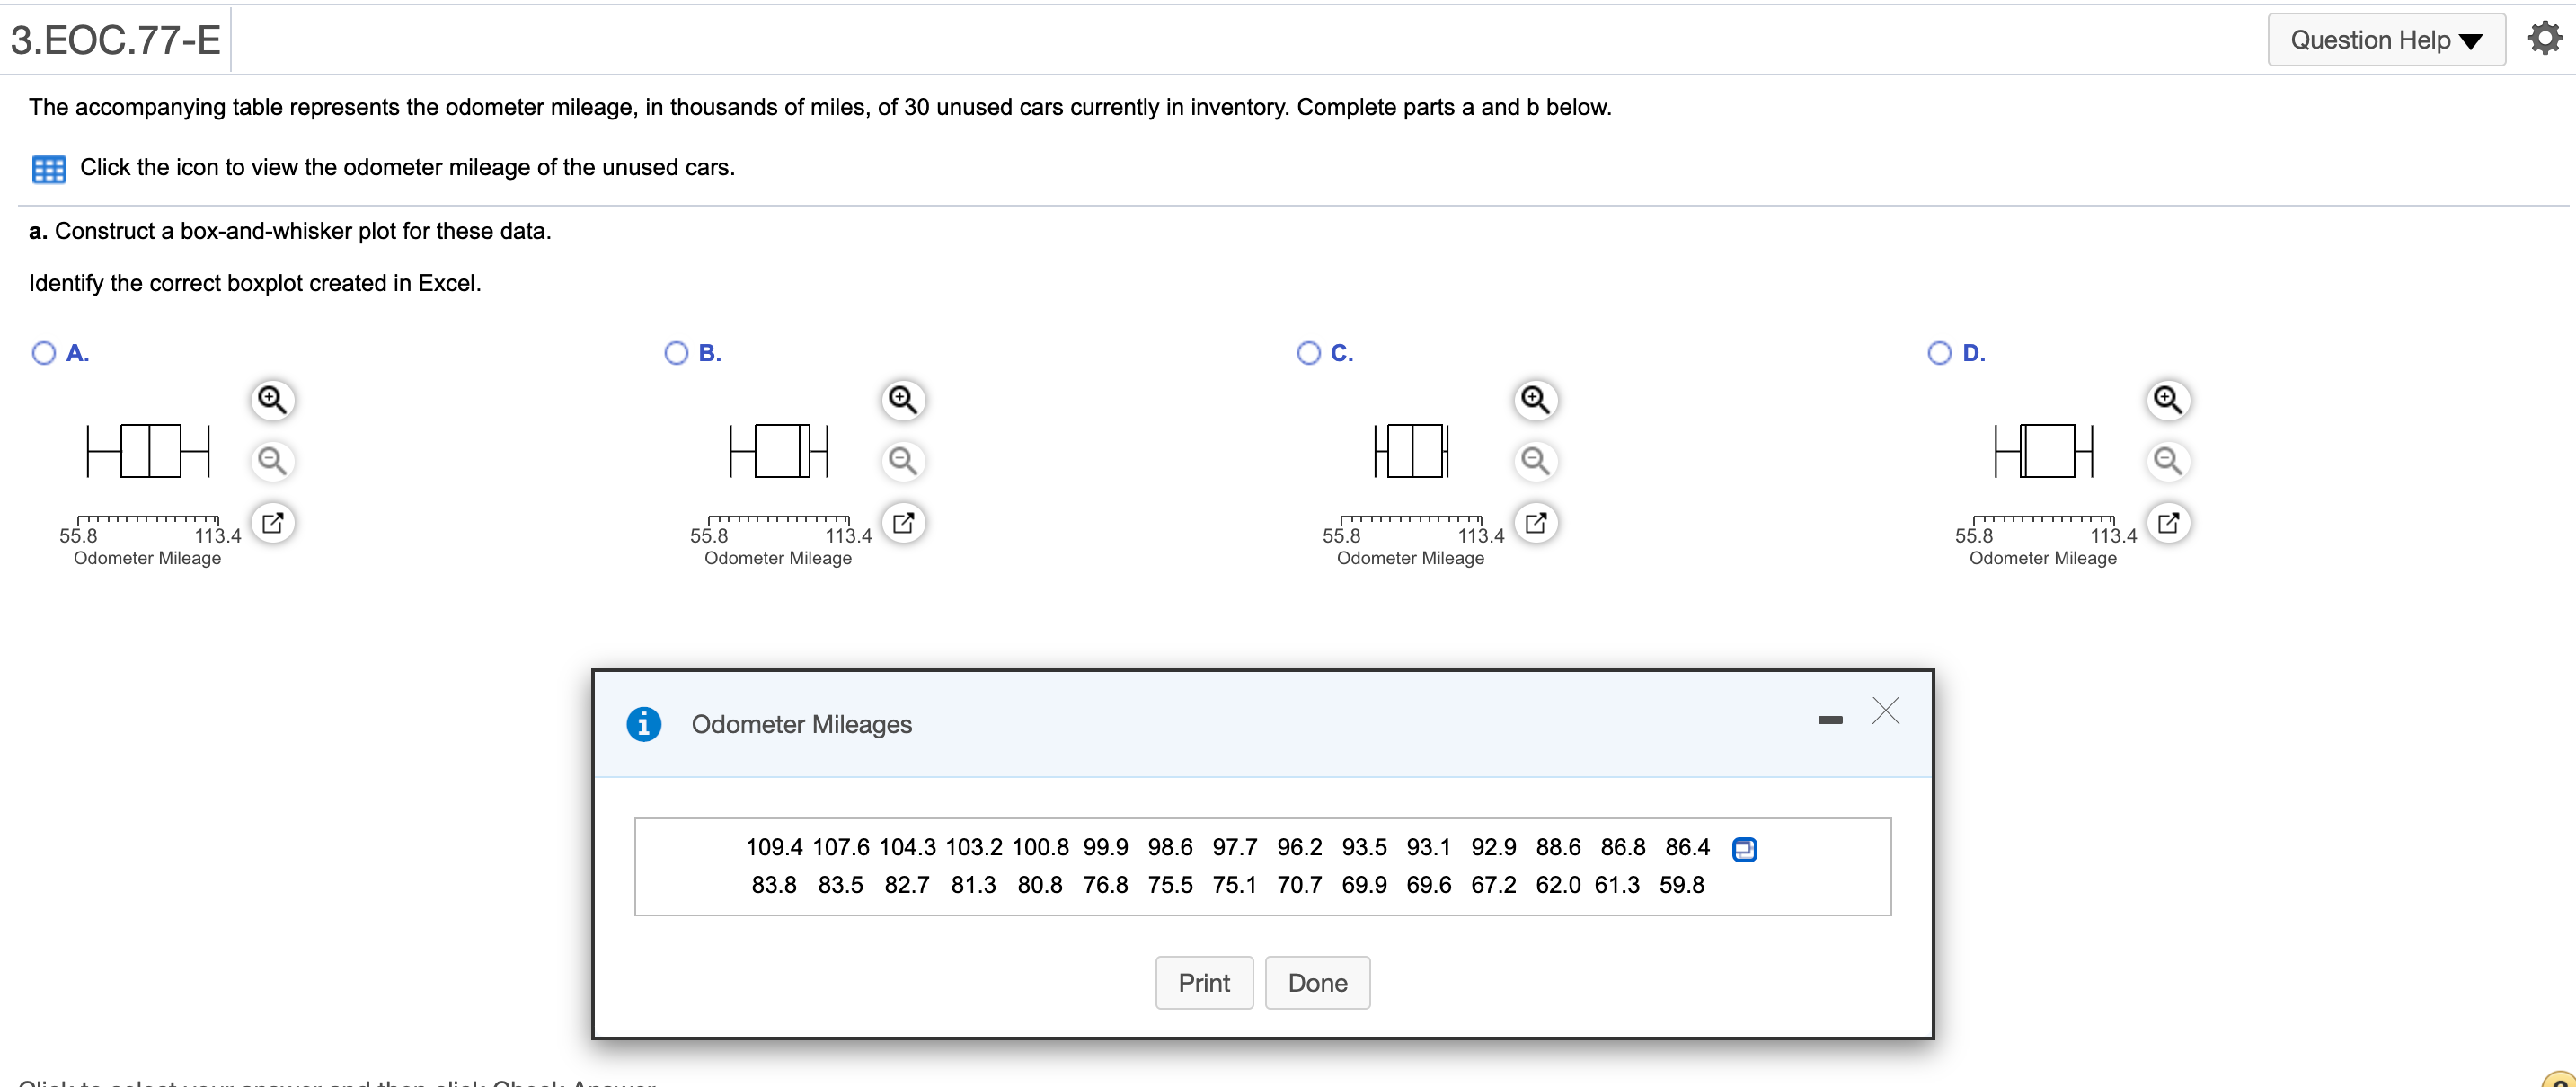
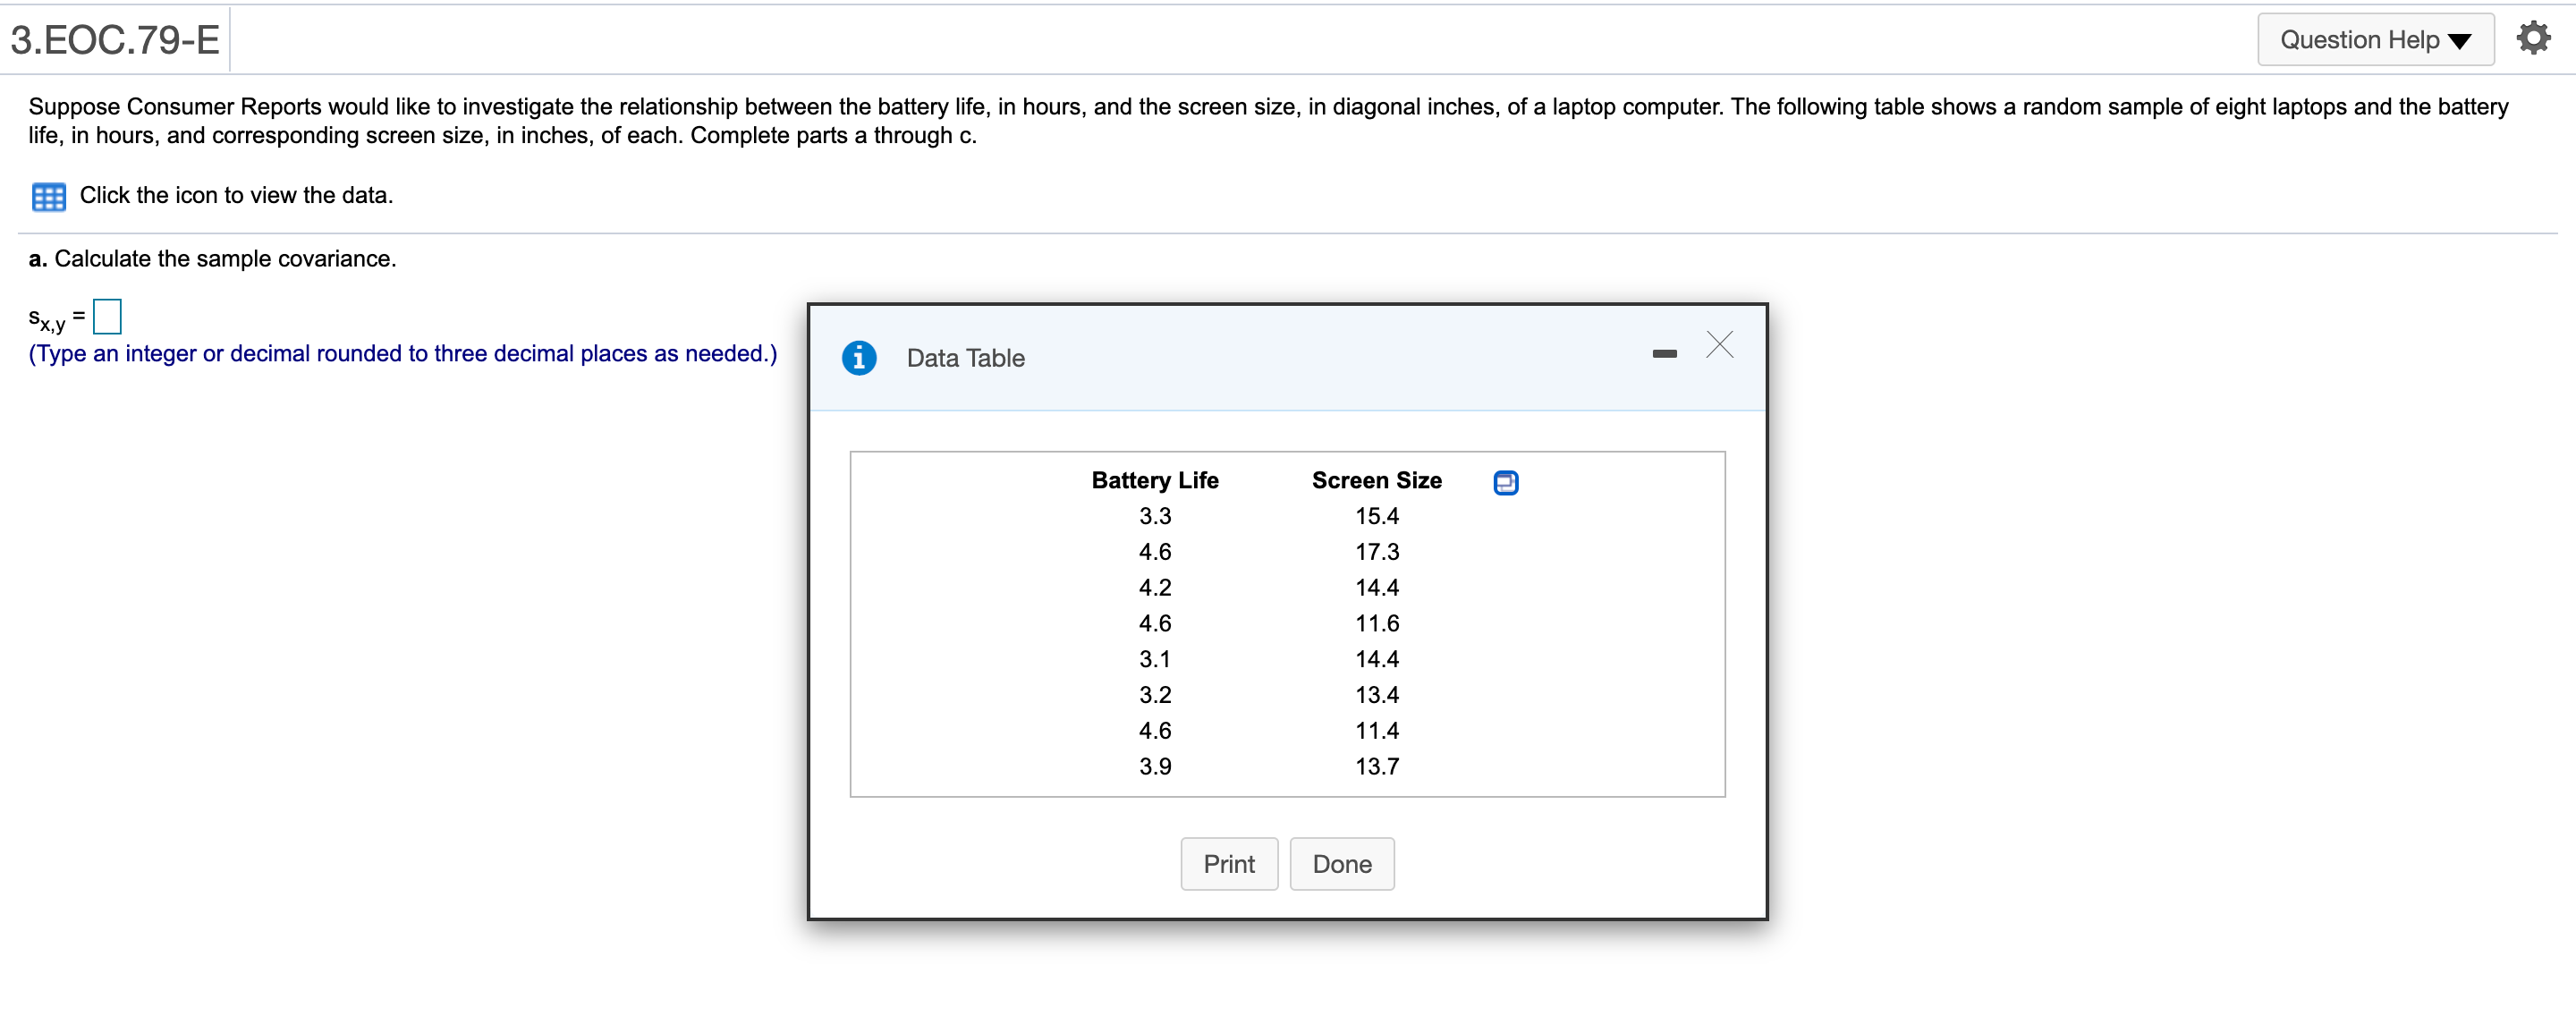
4..EOC72 ' Question Help 7 a A graduate class has 13 students with A grades and 15 students with B grades. Calculate the number of ways in which 6 Astudents and 6 B students can be uniquely selected. There are different ways to select the students. (Type a whole number.) 3HE0C66-E Question HelpV a As a measure of productivity. a cell phone carrier records the number of customers each of its retail employees activates weekly. An activation is dened as either a new customer signing a cell phone contract or an existing customer renewing a contract. The accompanying table shows the number of weekly activations for eight randomly selected employees along with their job-satisfaction levels rated on a scale of 1-10 (10 = most satised). Complete parts a through c. a Click the icon to view the data. 3. Calculate the sample covariance. sx'y = (Type an integer or decimal rounded to three decimal places as needed) 0 Data Table - X Activations Satisfaction a 36.2 8.0 23.8 7.4 39.2 8.4 38.3 8.8 20.8 6.3 27.8 7.5 33.6 8.0 25.5 7.4 Question Help 3.EOC.67-E The accompanying table lists customer satisfaction scores for the major mass-market car manufacturers for the U.S. Complete parts a through d below. Click the icon to view the table. - X i Data Table a. Determine the coefficient of variation. Coefficient of variation = (Round to two decimal places as needed.) Company Customer Satisfaction Fiat 739 Buick 860 Mazda 784 Chrysler 785 Hyundai 312 MINI 850 Nissan 822 Dodge 771 Ram 755 Volkswagen 314 Ford 796 GMC 837 Toyota 815 Mitsubishi 793 Honda 797 Jeep 753 Chevrolet 829 Subaru 8183.EOC.68-E Question Help The accompanying table shows the frequency distribution for the golf scores recorded during a certain golf tournament. If appropriate, use midpoints of ranges in finding approximate values. Complete parts a and b. Click the icon to view the frequency distribution for the golf scores. a. Calculate the approximate average golf score for the tournament. The approximate average golf score for the tournament is. (Round to one decimal place as needed.) i Golf Score Frequency Distribution - X Score Frequency 264-268 5 269-273 14 274-278 20 279-283 15 284-288 3 289-293 N Print Done3HEOC69-E Question Help V O The accompanying table shows the frequency distribution for the mileage on a sample of a certain rental company's rental cars. If appropriate, use midpoints of ranges in nding approximate values. Complete parts a and b. E Click the icon to View the frequency distribution for the mileage on the sample of cars. a. Calculate the approximate average mileage per car for the sample. The approximate average mileage for the sample is (Round to the nearest integer as needed.) o Mileage Frequency Distribution Mileage Frequency 9 3,000 to under 4,000 15 4,000 to under 5,000 9 5,000 to under 6,000 21 6,000 to under 7,000 10 7,000 to under 8,000 13 8,000 to under 9,000 8 ; Print Done Homework: Section 3.EOC Homework Score: 0 of 1 pt 11 of 14 (5 complete) 3.EOC.72-E The accompanying table lists the SAT scores for 27 college students. Complete parts a and b. 840 1,036 815 1,337 1,550 669 1,163 918 1,167 625 489 1,071 389 895 1,419 935 454 675 698 972 562 1,243 1,544 663 1,469 1,195 676 a. Identify the first, second, and third quartiles. The first quartile is 7. The second quartile is The third quartile is (Type integers or decimals. Do not round.)3.EOC.76-E Question Help The accompanying table indicates the battery life, in minutes, on a single charge, for 25 iPads. Complete parts a and b below. Click the icon to view the battery life of the iPads. a. Construct a box-and-whisker plot for these data. Identify the correct boxplot created in Excel. O A. O B. O c. OD. HA HTH HTH HOH 210 334 210 334 210 334 210 334 Battery Life Battery Life Battery Life Battery Life i Battery Life of iPads - X 214 214 227 230 235 239 240 244 247 255 258 264 269 278 280 282 285 285 290 295 301 308 325 327 330 Print Done3.EOC.77-E Question Help OF The accompanying table represents the odometer mileage, in thousands of miles, of 30 unused cars currently in inventory. Complete parts a and b below. Click the icon to view the odometer mileage of the unused cars. a. Construct a box-and-whisker plot for these data. Identify the correct boxplot created in Excel. O A. O B. O C. O D. HTH HOH HUH 55.8 113.4 55.8 113.4 55.8 113.4 55.8 113.4 Odometer Mileage Odometer Mileage Odometer Mileage Odometer Mileage i Odometer Mileages - X 109.4 107.6 104.3 103.2 100.8 99.9 98.6 97.7 96.2 93.5 93.1 92.9 88.6 86.8 86.4 83.8 83.5 82.7 81.3 80.8 76.8 75.5 75.1 70.7 69.9 69.6 67.2 62.0 61.3 59.8 Print Done3.EOC.79-E Question Help V O Suppose Consumer Reports would like to investigate the relationship between the battery life, in hours, and the screen size, in diagonal inches, of a laptop computer. The following table shows a random sample of eight laptops and the battery life, in hours, and corresponding screen size, in inches, of each. Complete parts a through c, E Click the icon to view the data. a. Calculate the sample covariance. 5X,y = (Type an integer or decimal rounded to three decimal places as needed.) 0 Data Table Battery Life Screen Size 9 3.3 15.4 4.6 17.3 4.2 14.4 4.6 11.6 3.1 14.4 3.2 13.4 4.6 11.4 3.9 13.7
Step by Step Solution
There are 3 Steps involved in it

Get step-by-step solutions from verified subject matter experts