

Question: Give me an answer please!! what are the missing things in the question?? What are the missing things, What should I add so you will
Give me an answer please!! what are the missing things in the question??
What are the missing things, What should I add so you will be able to solve the question? ??
Compare the cash flow statement with the profit and loss statement and the balance sheet.
what extra information if any is being conveyed by the cash flow statement that is not part of the other two statements? 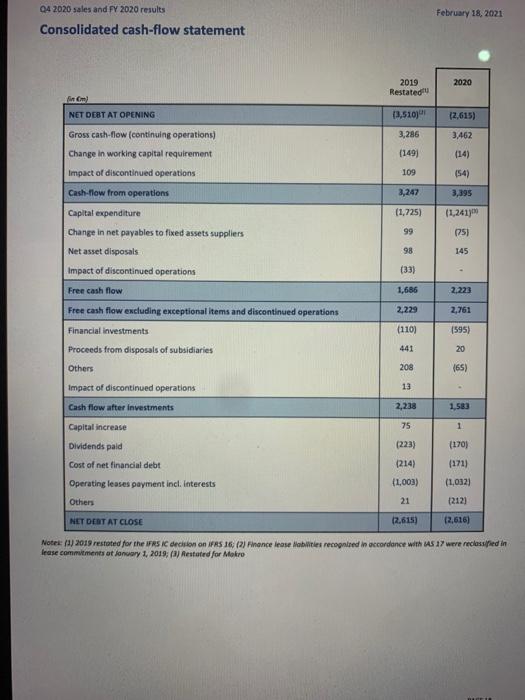
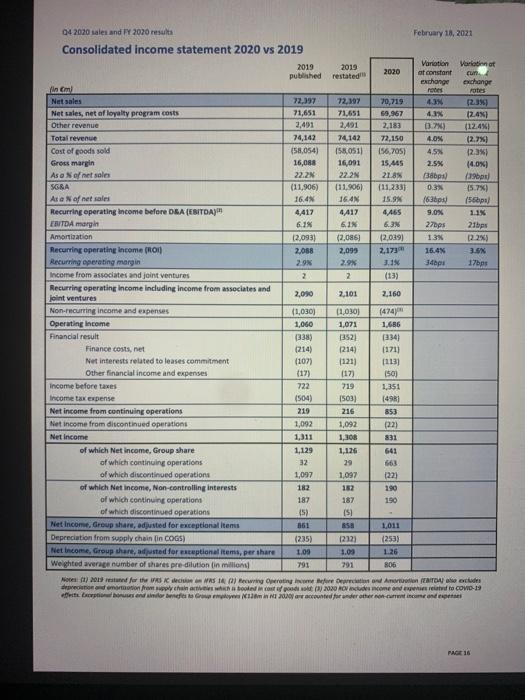
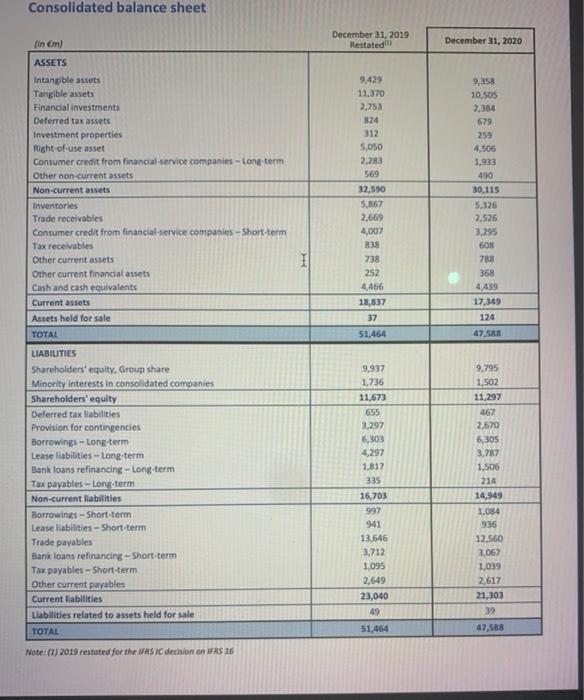
Q4 2020 sales and FY 2020 results February 18, 2021 Consolidated cash-flow statement 2020 2019 Restated firmy NET DEBT AT OPENING (3,510) (2,615) Gross cash-flow (continuing operations) 3.462 3,286 (149) Change in working capital requirement (14) 109 (54) 3,247 3,395 (1,725) (1,241 (75) 99 98 145 Impact of discontinued operations Cash-flow from operations Capital expenditure Change in net payable to fixed assets suppliers Net asset disposals Impact of discontinued operations Free cash flow Free cash flow excluding exceptional items and discontinued operations Financial investments Proceeds from disposals of subsidiaries Others (33) 1,686 2.223 2,229 2,761 (110) (595) 441 20 208 (65) Impact of discontinued operations 13 Cash flow after investments 2,238 1,583 Capital increase 75 1 Dividends paid (223) (170) Cost of net financial debt (171) (214) (1,003) Operating leases payment incl. Interests (1,032) Others 21 (212) NET DEBT AT CLOSE (2.615) (2,616) Note: (1)2019 restated for the FRS IC decision on IFRS 16 (2) Finance lease Mobiles recognised in accordance with AS 17 were reclassified in lease commitments of January 1, 2019) Restuted for Makro BE 04 2020 sales and FY 2020 results February 18, 2021 Consolidated income statement 2020 vs 2019 2019 2019 Variation Worlainnot 2020 published restated at constant cun exchange exchange finem ros Fotes Net sales 72.397 72,397 70,719 4.3 1235 Net sales, net of loyalty program costs 71,651 71,651 69,967 4.1 (241 Other revenue 2,491 2.491 2.183 0.7 112.4%) Total revenue 74,142 74.142 72,150 4.0% (2.7%) Cost of goods sold (58,054) 156.0511 156.705) 4.5 12.3%) Gross margin 16,00 16,091 15.45 2.5% (4.0%) As a Nonet sales 22.2N 22 2N 218% (38bps) (19) SORA (11,906) [11.906) (11,2331 0.3% 15.7%) As a N of net sales 16.4 16.4 15.99 163ps! (56) Recurring operating income before DEA (EBITDA 4,417 4417 4,465 9.0% 1.1% EBITDA margin 6.1% 61 6.3 2709 21bps Amortization 12,093) (2,086 12.039) 13% 02.2 Recurring operating Income (RON) 2,068 2,099 2,173 16.4% 3.5% Recurring operating margin 2.9% 2.9% 3.1% 34 17bps Income from associates and joint ventures 2 2 (13) Recurring operating income including income from associates and 2,090 2,101 2,160 joint ventures Non-recurring income and expenses (1,030) (1.030) (4747 Operating Income 1,060 1,071 1.686 Financial result (338) 13521 (334) Finance costs, net (214) (214) (171) Net interests related to leases commitment (107) (121 1113) Other financial income and expenses (17) (50) Income before taxes 722 1.351 Income tax expense 1504) 15031 [49] Net income from continuing operations 219 216 853 Net income from discontinued operations 1,092 1,092 (22) Net Income 1,311 1,308 831 of which Net income, Group share 1,129 1,126 641 of which continuing operations 32 29 663 of which discontinued operations 1,097 1,097 (22) of which Net Income, Non-controlling interests 182 182 190 of which continuing operations 187 190 of which discontinued operations [5] Net Income Group shan, adjusted for exceptional items RS 1,011 Depreciation from supply chain lin COGS) (235) 12121 (253) Net Income Groupshare, adjusted for exceptional items. per there 1.03 1.26 Weighted average number of shares pre-dilution in milion 791 806 More) petund fert) Pering og fore Anden forude romatiche cost poodi 2020 Onde come and set to COWO-19 arattappaaaN UNNarantee lrantha 719 187 108 701 PAGE 16 Consolidated balance sheet December 31, 2019 Restated December 31, 2020 finem) ASSETS Intangible assets Tangible assets Financial investments Deferred tax assets Investment properties Right of use asset Consumer credit from financial service companies - Long term Other non-current assets Non-current assets Inventories Trade receivables Consumer credit from financial service companies - Short-term Tax receivables Other current assets Other current financial assets Cash and cash equivalents Current assets Assets held for sale TOTAL 9.429 11.370 2,753 124 312 5,050 2,283 569 32,590 5,867 2,669 4,007 838 738 252 4,466 18,837 37 9,358 10,505 2,384 679 259 4.505 1,933 490 30,115 5.326 2.526 3.295 608 788 368 4.439 17,349 124 1 51.464 47,588 9,937 1,736 11.673 655 3,297 6,303 4.297 1.817 335 LIABILITIES Shareholders' equity, Group share Minority interests in consolidated companies Shareholders' equity Deferred tax liabilities Provision for contingencies Borrowings - Long-term Lease liabilities --Long-term Bank loans refinancing - Long-term Tax payables - Long term Non-current liabilities Borrowings -Short-term Lease liabilities -Short-term Trade payables Bank loans refinancing -Short-term Tax payables -Short-term Other current payables Current liabilities Liabilities related to assets held for sale TOTAL 16,703 997 9.795 1,502 11,297 467 2,670 6,305 3.787 1.506 214 14,949 1,084 936 12.560 3,067 1,039 2.617 21,303 39 47,588 941 13,646 3,712 1.095 2,649 23,040 49 51,464 Note: (1) 2019 restated for the RSI decision on IFRS 16
Step by Step Solution
There are 3 Steps involved in it

Get step-by-step solutions from verified subject matter experts