

Question: Give me the whole MATLAB code! Starting with the plot in the Fig, sketch a plot of x(tt1) when t1=0.0075. Repeat for t1=0.01. Make sure
Give me the whole MATLAB code!
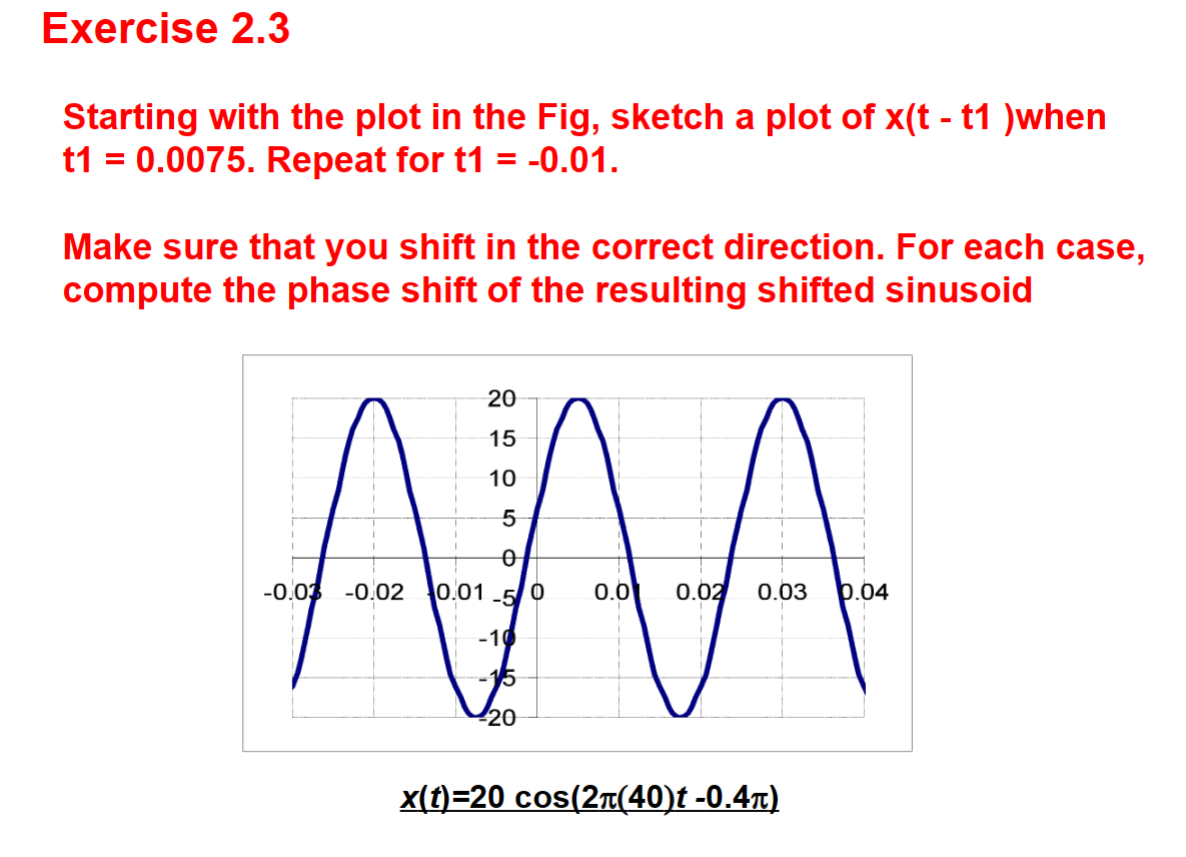
Starting with the plot in the Fig, sketch a plot of x(tt1) when t1=0.0075. Repeat for t1=0.01. Make sure that you shift in the correct direction. For each case, compute the phase shift of the resulting shifted sinusoid x(t)=20cos(2(40)t0.4)
Step by Step Solution
There are 3 Steps involved in it
1 Expert Approved Answer
Step: 1 Unlock

Question Has Been Solved by an Expert!
Get step-by-step solutions from verified subject matter experts
Step: 2 Unlock
Step: 3 Unlock