

Question: Give short explanaition how it was calculated 2. Considering the following information fill in the gaps. Sales are growing at 15% for year 21, 20%
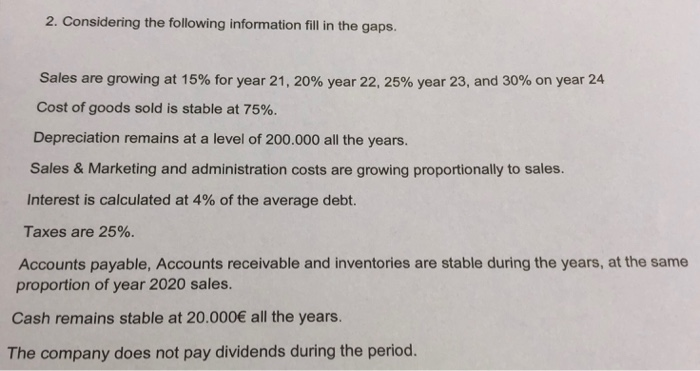
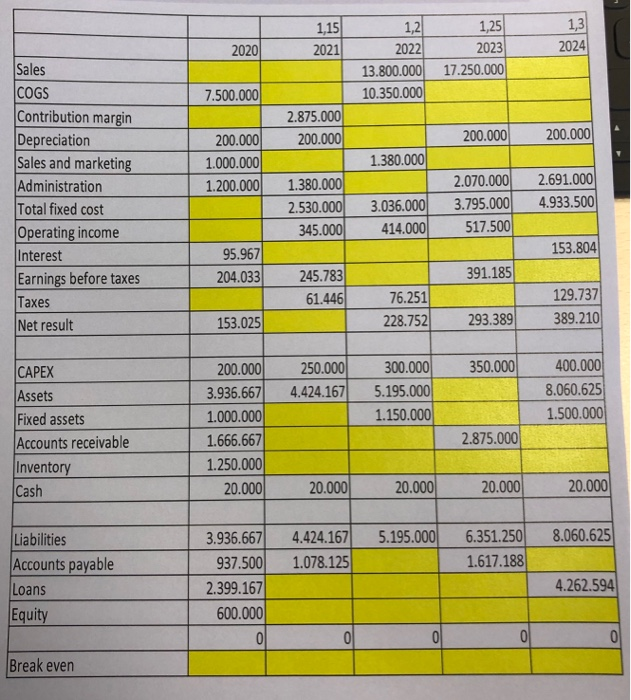
2. Considering the following information fill in the gaps. Sales are growing at 15% for year 21, 20% year 22, 25% year 23, and 30% on year 24 Cost of goods sold is stable at 75%. Depreciation remains at a level of 200.000 all the years. Sales & Marketing and administration costs are growing proportionally to sales. Interest is calculated at 4% of the average debt. Taxes are 25%. Accounts payable, Accounts receivable and inventories are stable during the years, at the same proportion of year 2020 sales. Cash remains stable at 20.000 all the years. The company does not pay dividends during the period. 13 1,15 2021 2020 1,2 2022 13.800.000 10.350.000 1,25 2023 17.250.000 2024 7.500.000 2.875.000 200.000 200.000 200.000 200.000 1.000.000 1.200.000 1.380.000 Sales COGS Contribution margin Depreciation Sales and marketing Administration Total fixed cost Operating income Interest Earnings before taxes Taxes Net result 1.380.000 2.530.000 345.000 2.070.000 3.795.000 517.500 2.691.000 4.933.500 3.036.000 414.000 153.804 95.967 204.033 391.185 245.783 61.446 76.251 228.752 129.737 389.210 153.025 293.389 350.000 250.000 4.424.167 300.000 5.195.000 1.150.000 400.000 8.060.625 1.500.000 CAPEX Assets Fixed assets Accounts receivable Inventory Cash 200.000 3.936.667 1.000.000 1.666.667 1.250.000 20.000 2.875.000 20.000 20.000 20.000 20.000 5.195.000 8.060.625 4.424.167 1.078.125 6.351.250 1.617.188 Liabilities Accounts payable Loans Equity 3.936.667) 937.500 2.399.167 600.000 4.262.594 0 0 0 0 Break even
Step by Step Solution
There are 3 Steps involved in it

Get step-by-step solutions from verified subject matter experts