

Question: Give solution on excel sheetP - Chart: A manufacturing process is monitored using a P - chart for the proportion of defective items in a
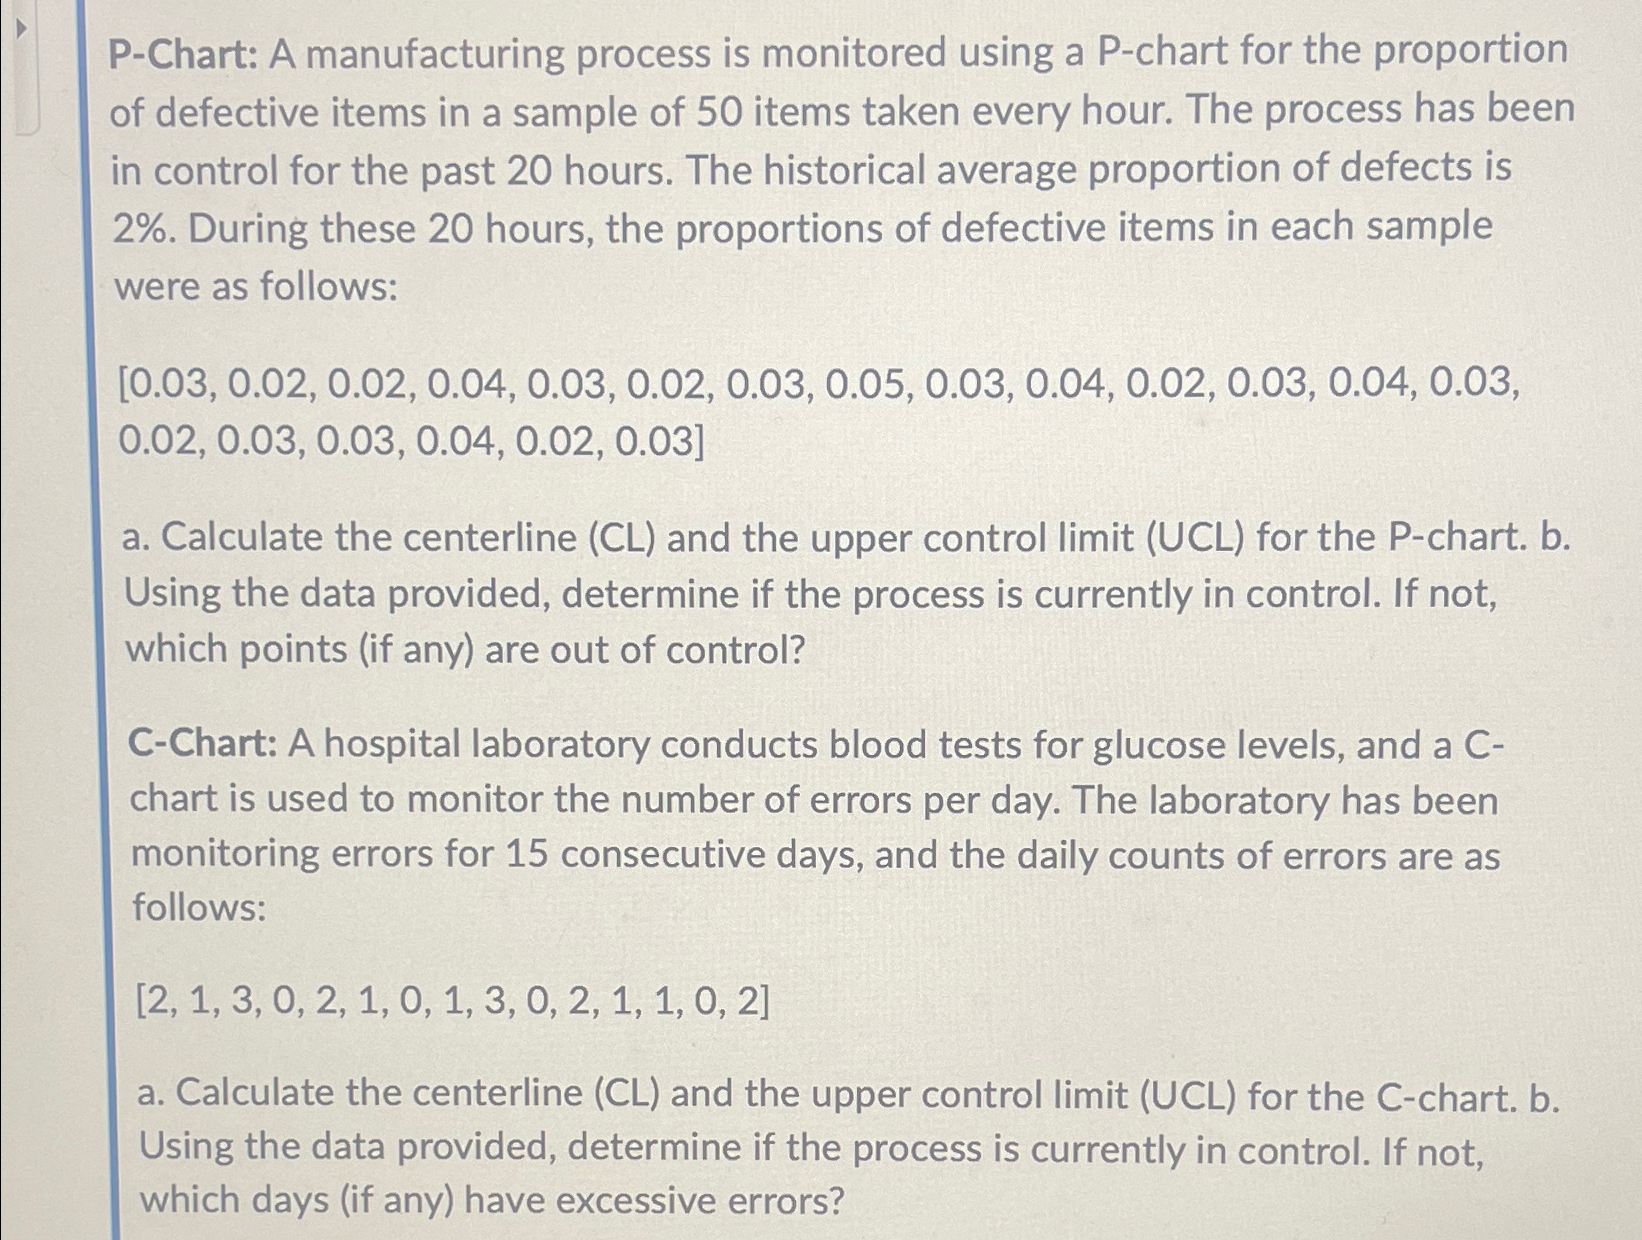
Give solution on excel sheetPChart: A manufacturing process is monitored using a Pchart for the proportion of defective items in a sample of items taken every hour. The process has been in control for the past hours. The historical average proportion of defects is During these hours, the proportions of defective items in each sample were as follows:
a Calculate the centerline CL and the upper control limit UCL for the Pchart. b Using the data provided, determine if the process is currently in control. If not, which points if any are out of control?
CChart: A hospital laboratory conducts blood tests for glucose levels, and a Cchart is used to monitor the number of errors per day. The laboratory has been monitoring errors for consecutive days, and the daily counts of errors are as follows:
a Calculate the centerline CL and the upper control limit UCL for the Cchart. b Using the data provided, determine if the process is currently in control. If not, which days if any have excessive errors?
Step by Step Solution
There are 3 Steps involved in it
1 Expert Approved Answer
Step: 1 Unlock

Question Has Been Solved by an Expert!
Get step-by-step solutions from verified subject matter experts
Step: 2 Unlock
Step: 3 Unlock