

Question: GIVE SOLUTON USING POM QM - PROVIDE SCREEN SHOTS FOR VERIFICATION igure 2. First Quarter Sales Projections for 2019 Below is the historical 1st quarter
 GIVE SOLUTON USING POM QM - PROVIDE SCREEN SHOTS FOR VERIFICATION
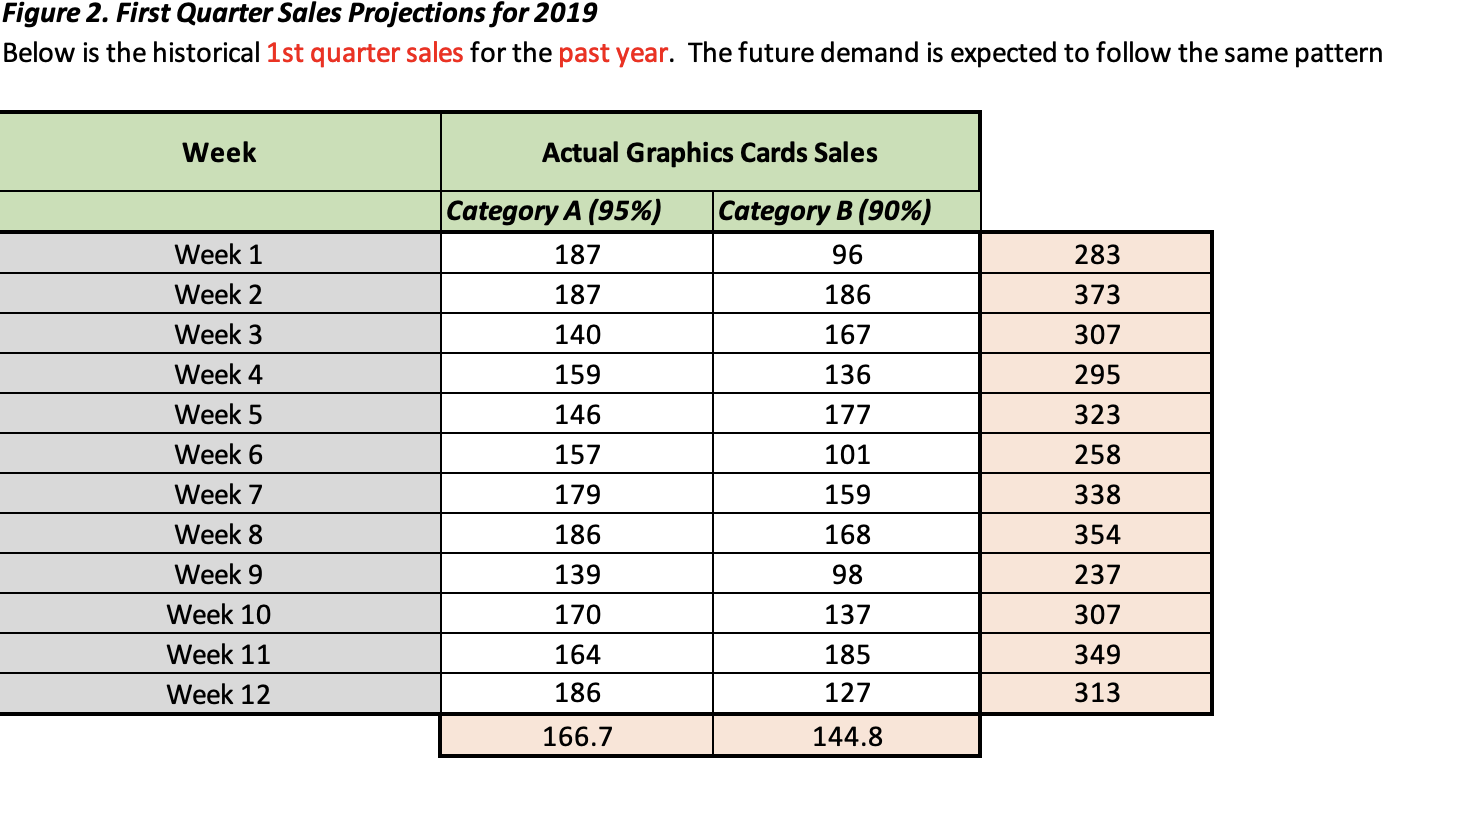
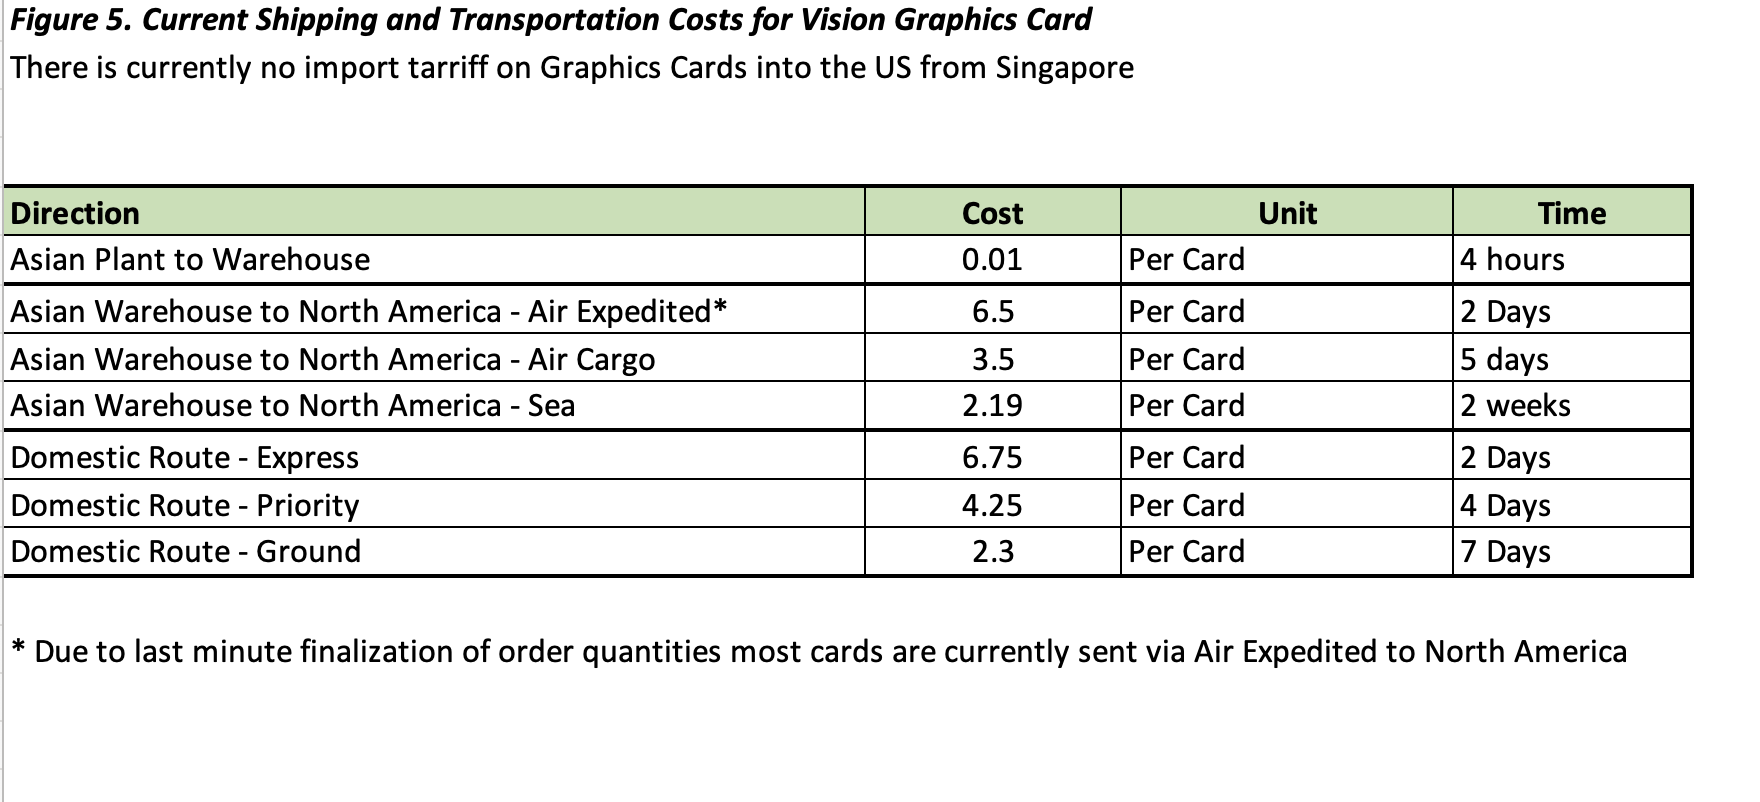
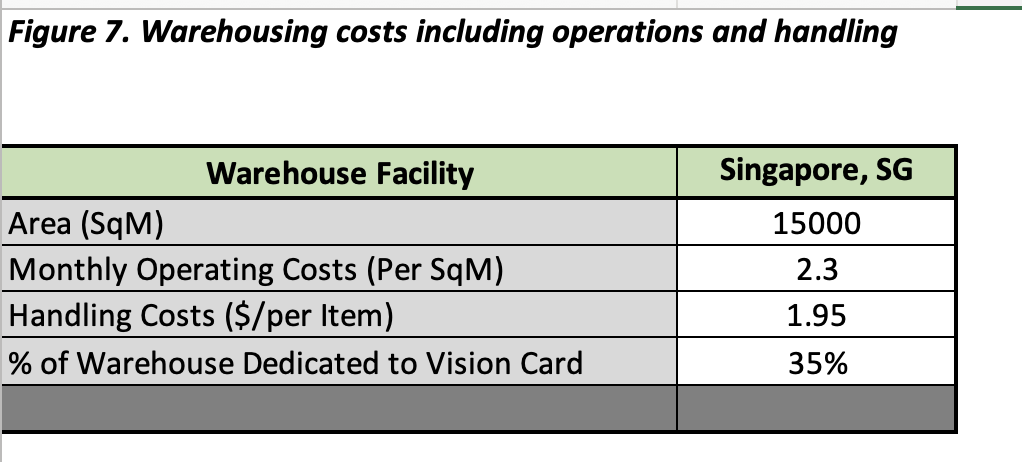
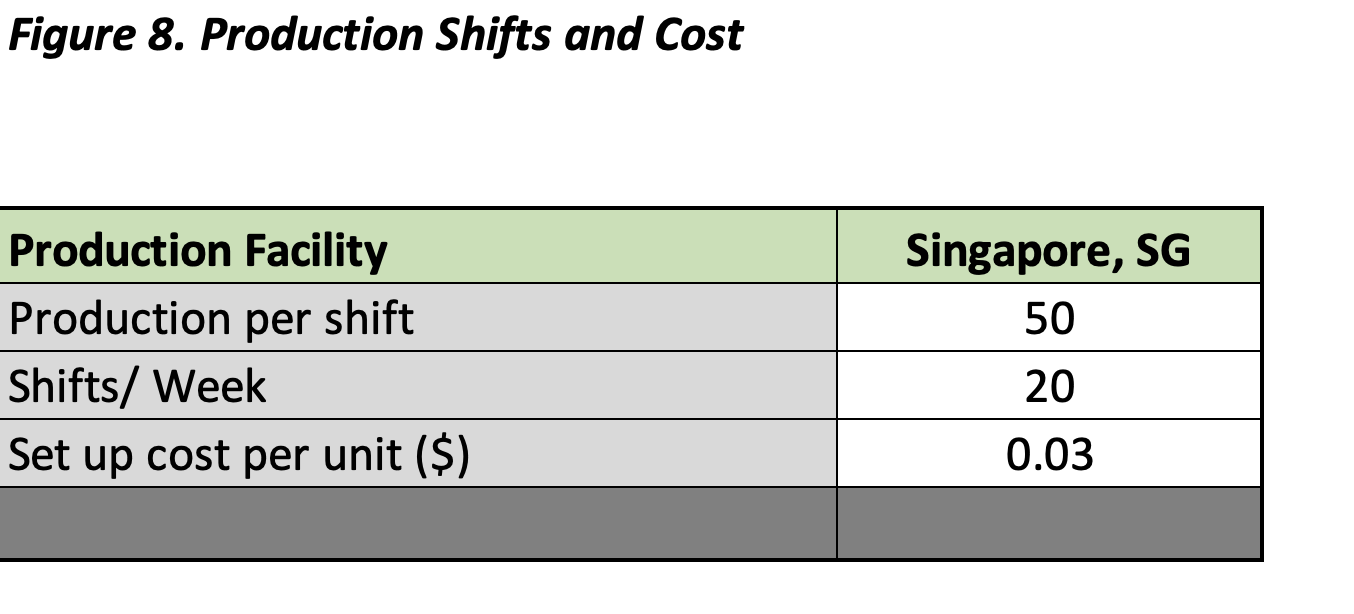
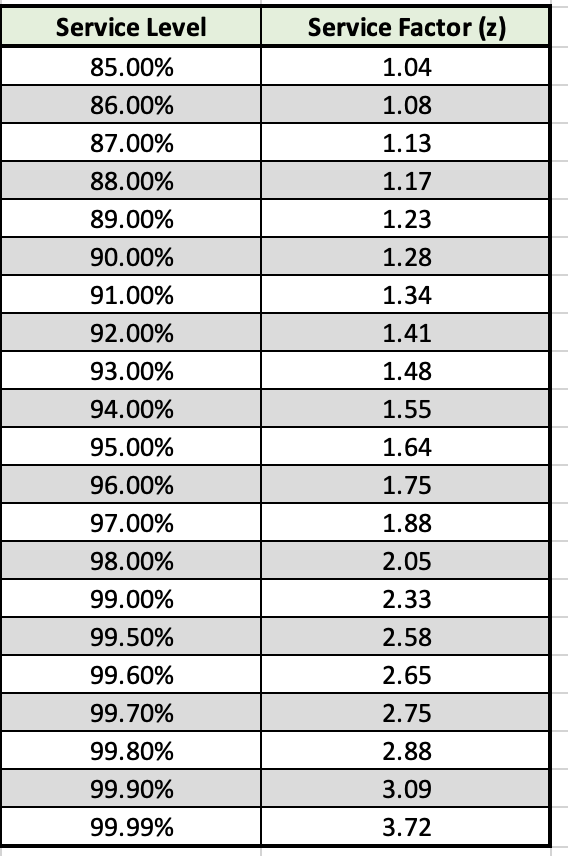
igure 2. First Quarter Sales Projections for 2019 Below is the historical 1st quarter sales for the past year. The future demand is expected to follow the same pattern Figure 5. Current Shipping and Transportation Costs for Vision Graphics Card There is currently no import tarriff on Graphics Cards into the US from Singapore * Due to last minute finalization of order quantities most cards are currently sent via Air Expedited to North America Figure 7. Warehousing costs including operations and handling Figure 8. Production Shifts and Cost \begin{tabular}{|c|c|} \hline Service Level & Service Factor (z) \\ \hline 85.00% & 1.04 \\ \hline 86.00% & 1.08 \\ \hline 87.00% & 1.13 \\ \hline 88.00% & 1.17 \\ \hline 89.00% & 1.23 \\ \hline 90.00% & 1.28 \\ \hline 91.00% & 1.34 \\ \hline 92.00% & 1.41 \\ \hline 93.00% & 1.48 \\ \hline 94.00% & 1.55 \\ \hline 95.00% & 1.64 \\ \hline 96.00% & 1.75 \\ \hline 97.00% & 1.88 \\ \hline 98.00% & 2.05 \\ \hline 99.00% & 2.33 \\ \hline 99.50% & 2.58 \\ \hline 99.60% & 2.65 \\ \hline 99.70% & 2.75 \\ \hline 99.80% & 2.88 \\ \hline 99.90% & 3.09 \\ \hline 99.99% & 3.72 \\ \hline \end{tabular} igure 2. First Quarter Sales Projections for 2019 Below is the historical 1st quarter sales for the past year. The future demand is expected to follow the same pattern Figure 5. Current Shipping and Transportation Costs for Vision Graphics Card There is currently no import tarriff on Graphics Cards into the US from Singapore * Due to last minute finalization of order quantities most cards are currently sent via Air Expedited to North America Figure 7. Warehousing costs including operations and handling Figure 8. Production Shifts and Cost \begin{tabular}{|c|c|} \hline Service Level & Service Factor (z) \\ \hline 85.00% & 1.04 \\ \hline 86.00% & 1.08 \\ \hline 87.00% & 1.13 \\ \hline 88.00% & 1.17 \\ \hline 89.00% & 1.23 \\ \hline 90.00% & 1.28 \\ \hline 91.00% & 1.34 \\ \hline 92.00% & 1.41 \\ \hline 93.00% & 1.48 \\ \hline 94.00% & 1.55 \\ \hline 95.00% & 1.64 \\ \hline 96.00% & 1.75 \\ \hline 97.00% & 1.88 \\ \hline 98.00% & 2.05 \\ \hline 99.00% & 2.33 \\ \hline 99.50% & 2.58 \\ \hline 99.60% & 2.65 \\ \hline 99.70% & 2.75 \\ \hline 99.80% & 2.88 \\ \hline 99.90% & 3.09 \\ \hline 99.99% & 3.72 \\ \hline \end{tabular}
Step by Step Solution
There are 3 Steps involved in it

Get step-by-step solutions from verified subject matter experts