

Question: GIVE THE COMPARATIVE INCOME STATEMENT HORIZONTAL AND VERTICAL ANALYSIS FROM THE FOLLOWING INCOME STATEMENT BELOW JOLLIBEE INCOME STATEMENT Operating Income -12.81b Operating Margin -9.91 JOLLIBEE
GIVE THE COMPARATIVE INCOME STATEMENT HORIZONTAL AND VERTICAL ANALYSIS FROM THE FOLLOWING INCOME STATEMENT BELOW
JOLLIBEE INCOME STATEMENT
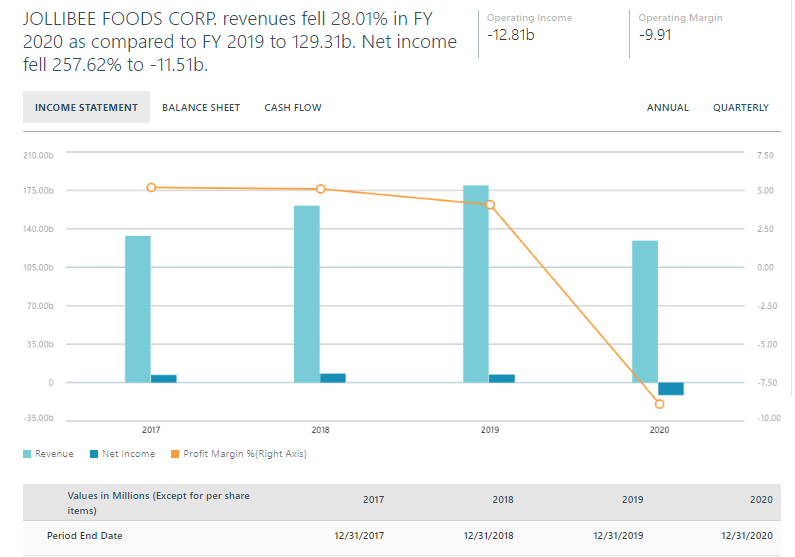
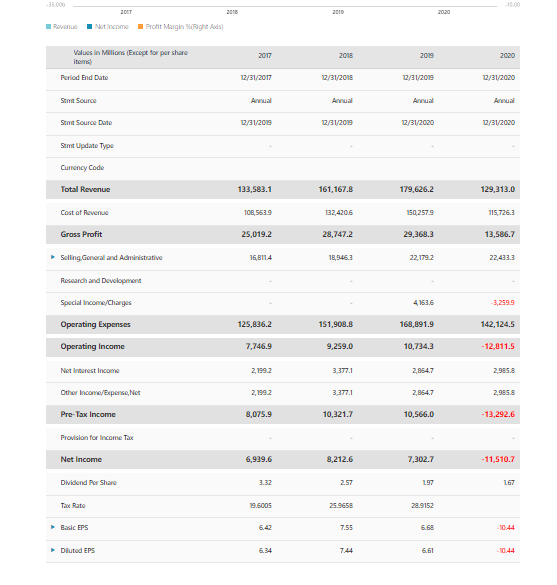
Operating Income -12.81b Operating Margin -9.91 JOLLIBEE FOODS CORP. revenues fell 28.01% in FY 2020 as compared to FY 2019 to 129.31b. Net income fell 257.62% to -11.51b. INCOME STATEMENT BALANCE SHEET CASH FLOW ANNUAL QUARTERLY 210.000 7.50 175.000 5.00 140.000 2.50 105.000 0.00 70.000 -2.50 35.000 -5.00 0 -7.50 35.000 -10.00 2017 2018 2019 2020 Revenue Net Income Profit Margin %(Right Axis) Values in Millions (Except for per share items) 2017 2018 2019 2020 Period End Date 12/31/2017 12/31/2018 12/31/2019 12/31/2020 10.00 2DIT 2016 2010 20120 Revenue Natincome Profit Margin Right Ads) Values in Millions (Except for per share 2017 2018 2019 2020 Period End Date 12/31/2017 12/31/2018 12/31/2019 12/31/2020 Strit Source Annual Annual Annual Annual Set Source Dute 12/31/2019 12/31/2019 12/31/2020 12/31/2020 Strnit Update Type Currency Code Total Revenue 133,583.1 161,167.8 179,626.2 129,313.0 Cost of Revenue 108.553.9 132 420.6 150.2579 115.7263 Gross Profit 25,019.2 28,747.2 29,368.3 13,586.7 Selling General and Administrative 16,811.4 18,946.3 22,1792 22,433.3 Research and Development Special Income/Charges 4153.5 3,2599 Operating Expenses 125,836.2 151,908.8 168,891.9 142, 124.5 Operating Income 7,746.9 9,259.0 10,734.3 - 12,811.5 Net Interest Income 2,2 3.377.1 2,854.7 29058 Other Income/Expense, Net 2,199,2 3,377.1 2,9547 2.985. Pre-Tax Income 8,075.9 10,321.7 10,566.0 - 13,292.6 Provision for Income Tax Net Income 6,939.6 8,212.6 7,302.7 - 11,510.7 Dividend per Share 3.32 2.57 197 167 Tax Rate 19.5005 25.9656 28.9152 Basic EPS 7.55 6.68 10.44 Diluted EPS 6.34 7.44 6.61 10.44 Operating Income -12.81b Operating Margin -9.91 JOLLIBEE FOODS CORP. revenues fell 28.01% in FY 2020 as compared to FY 2019 to 129.31b. Net income fell 257.62% to -11.51b. INCOME STATEMENT BALANCE SHEET CASH FLOW ANNUAL QUARTERLY 210.000 7.50 175.000 5.00 140.000 2.50 105.000 0.00 70.000 -2.50 35.000 -5.00 0 -7.50 35.000 -10.00 2017 2018 2019 2020 Revenue Net Income Profit Margin %(Right Axis) Values in Millions (Except for per share items) 2017 2018 2019 2020 Period End Date 12/31/2017 12/31/2018 12/31/2019 12/31/2020 10.00 2DIT 2016 2010 20120 Revenue Natincome Profit Margin Right Ads) Values in Millions (Except for per share 2017 2018 2019 2020 Period End Date 12/31/2017 12/31/2018 12/31/2019 12/31/2020 Strit Source Annual Annual Annual Annual Set Source Dute 12/31/2019 12/31/2019 12/31/2020 12/31/2020 Strnit Update Type Currency Code Total Revenue 133,583.1 161,167.8 179,626.2 129,313.0 Cost of Revenue 108.553.9 132 420.6 150.2579 115.7263 Gross Profit 25,019.2 28,747.2 29,368.3 13,586.7 Selling General and Administrative 16,811.4 18,946.3 22,1792 22,433.3 Research and Development Special Income/Charges 4153.5 3,2599 Operating Expenses 125,836.2 151,908.8 168,891.9 142, 124.5 Operating Income 7,746.9 9,259.0 10,734.3 - 12,811.5 Net Interest Income 2,2 3.377.1 2,854.7 29058 Other Income/Expense, Net 2,199,2 3,377.1 2,9547 2.985. Pre-Tax Income 8,075.9 10,321.7 10,566.0 - 13,292.6 Provision for Income Tax Net Income 6,939.6 8,212.6 7,302.7 - 11,510.7 Dividend per Share 3.32 2.57 197 167 Tax Rate 19.5005 25.9656 28.9152 Basic EPS 7.55 6.68 10.44 Diluted EPS 6.34 7.44 6.61 10.44
Step by Step Solution
There are 3 Steps involved in it

Get step-by-step solutions from verified subject matter experts