

Question: Given a bond with expected return of 5% and standard deviation of 8%,. A stock with expected return of 10% and standard deviation of 20%,
Given a bond with expected return of 5% and standard deviation of 8%,. A stock with expected return of 10% and standard deviation of 20%, a correlation of -0.10 between the bond and stock. The Treasury bill return is 3%. Tabulate and draw the investment opportunity set of the two risky assets, using the increment of 25% in investment weight. Plot the investment opportunity set, mark the minimum variance portfolio, the optimal portfolio and draw the CAL between the risk free investment and the optimal portfolio.
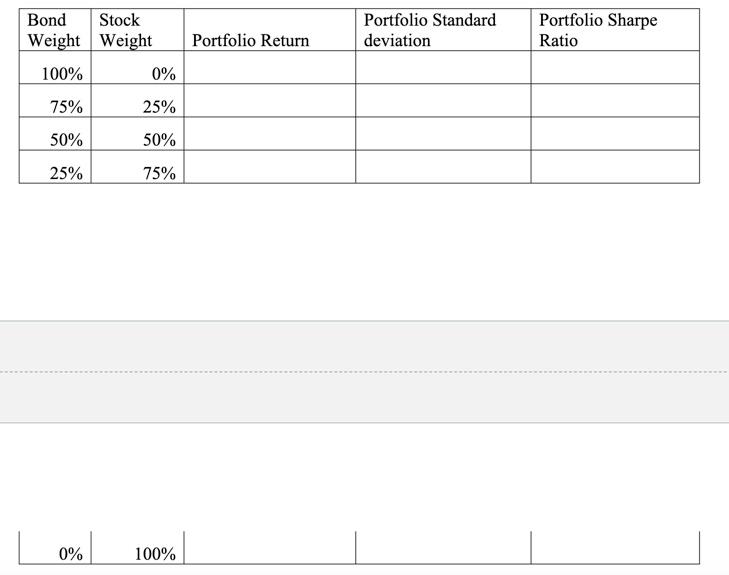
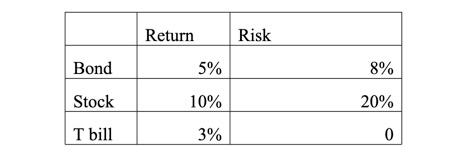
Bond Stock Weight Weight 100% 0% Portfolio Standard deviation Portfolio Sharpe Ratio Portfolio Return 75% 25% 50% 50% 25% 75% 0% 100% Return Risk 5% Bond 8% Stock 10% 20% T bill 3% 0 Bond Stock Weight Weight 100% 0% Portfolio Standard deviation Portfolio Sharpe Ratio Portfolio Return 75% 25% 50% 50% 25% 75% 0% 100% Return Risk 5% Bond 8% Stock 10% 20% T bill 3% 0
Step by Step Solution
There are 3 Steps involved in it

Get step-by-step solutions from verified subject matter experts