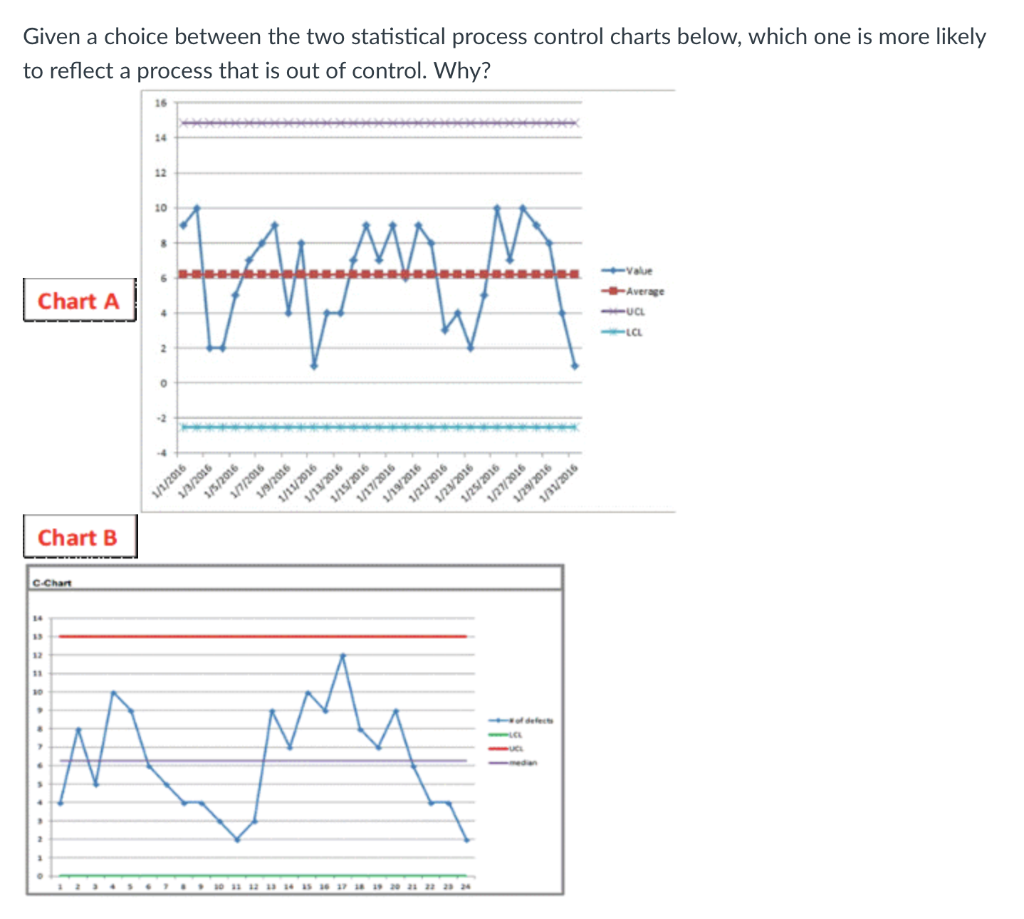
Question: Given a choice between the two statistical process control charts below, which one is more likely to reflect a process that is out of control.

Given a choice between the two statistical

Given a choice between the two statistical process control charts below, which one is more likely to reflect a process that is out of control. Why? 12 10 8 A MA M w Chart A Value -Average -UCL - 2 0 1/3/2016 9to2/S/ 1/9/2016 Stot/ 1/11/2016 1/15/2016 Stok 9102/ STO/21/1 1/23/2016 1/1/2016 1/7/2016 1/25/2016 1/19/2 1/21/2016 1/29/2016 1/31/2016 Chart B c.Chart M lui

Step by Step Solution

There are 3 Steps involved in it

1 Expert Approved Answer
Step: 1 Unlock blur-text-image
Question Has Been Solved by an Expert!

Get step-by-step solutions from verified subject matter experts

Step: 2 Unlock
Step: 3 Unlock

Students Have Also Explored These Related General Management Questions!