

Question: Given a set of points on a graph (called a scattergram), a regression line is the line which best describes the behavior of the points,

Given a set of points on a graph (called a scattergram), a regression line is the line which best describes the behavior of the points, i.e. it's the line that best fits the trend of the points. The regression line is, on average, closer to all of the points than any other line. A regression line can be used to find a pattern in a diverse set of points, which can help predict results in the future, or fill in any missing data with the best estimate possible. On the following page is a scattergram with 10 data points, where each point represents the profit (in millions of dollars) of a company in the years since they began selling their product.
Do the following:
1. With a ruler, draw the best eye-balled estimate of the regression line (as described above). Make sure the line extends to the edges of the graph box. It's not necessary for the regression line to pass through any of the plotted points (although it's fine if it does) - it is ideal for a line that gets as close as possible to all the points simultaneously.
There are two options to draw the estimated regression line, depending on whether there is a printer:
? If there is have access to a printer, print the attached scattergram, then use a ruler to draw the regression line.
? If there is not a printer, use a program on a computer that allows drawing on/markup an image (for example, Microsoft Paint, or Paintbrush for Macs, etc.). 2. Find the equation of the line drawn in step 1 (write the final answer in slope-intercept form on the line provided below). To do this, find the slope of the line using slope formula and two points on the line. Look for two points on the line that are near (or on) grid lines, to increase the accuracy of the approximation of the coordinates of the points. After calculating the slope, find the equation of the line using any methods. Be sure to show work. Equation of regression line: _________________________ 3. We know slope measures the steepness of a line - but what is the real-world interpretation of the slope in the context of this application problem, and what would the units of measurement be?
4. Assuming the trend over the last 10 years continues, use the regression equation (sometimes called a prediction equation) to predict what the profit will be in year 11. Show calculation.
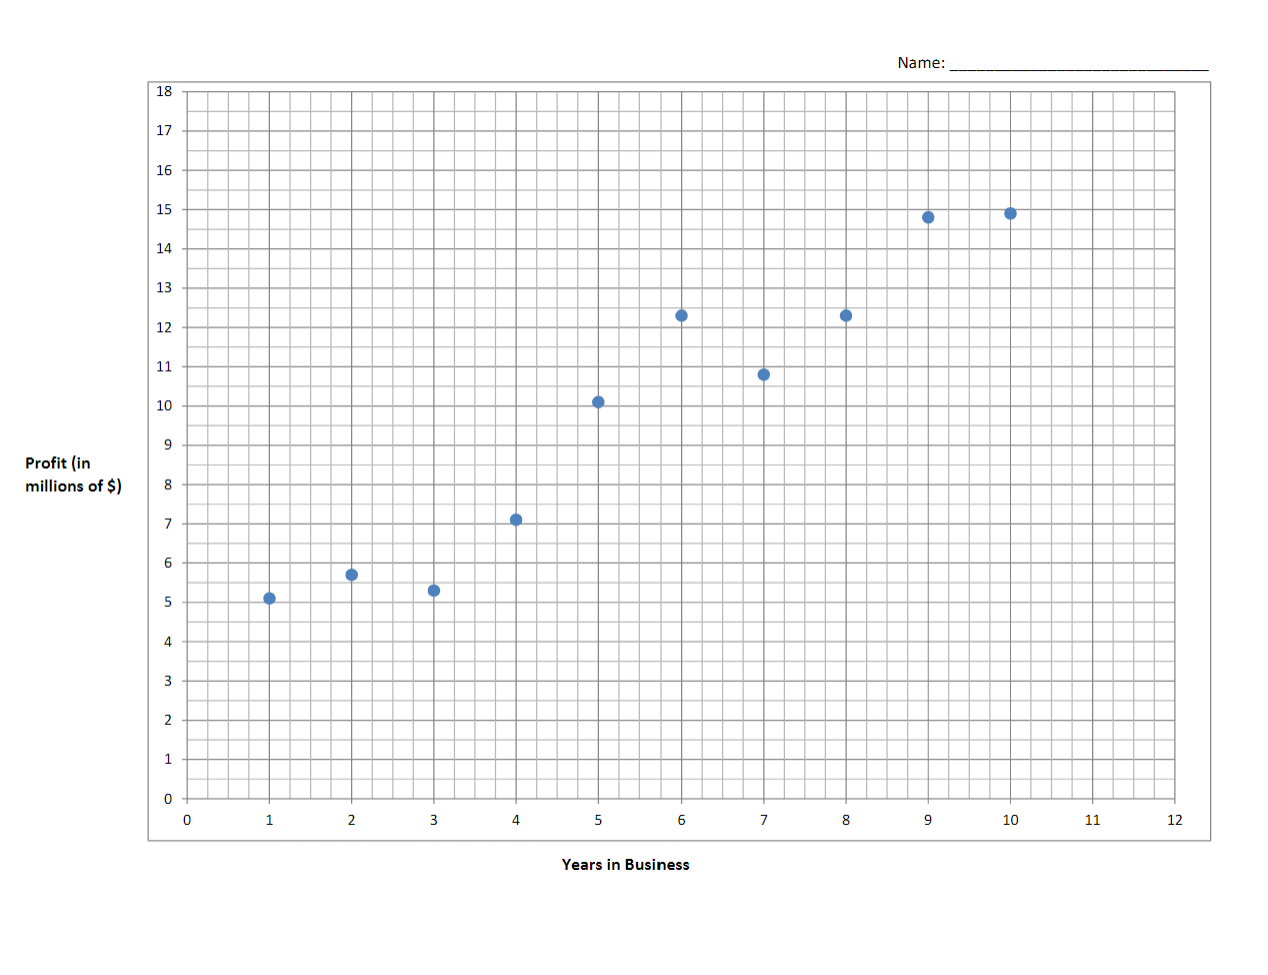
Name: 18 17 16 15 14 13 12 11 10 Profit (in 00 millions of $) un 4 3 N 0 8 9 10 11 12 6 7 0 1 2 3 4 5 Years in Business
Step by Step Solution
There are 3 Steps involved in it

Get step-by-step solutions from verified subject matter experts