

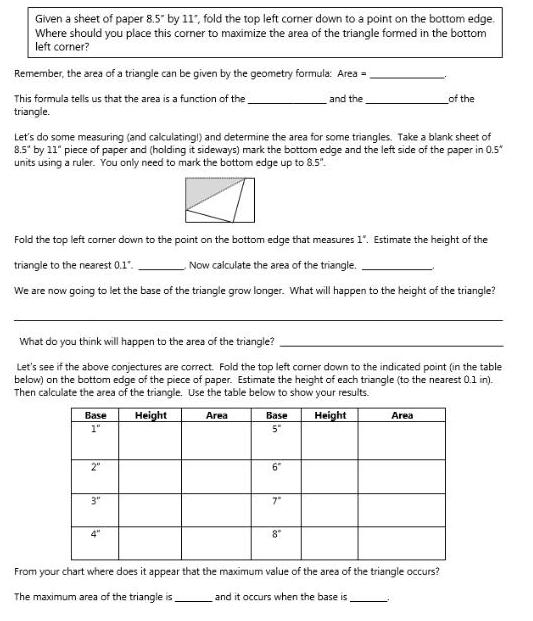
Given a sheet of paper 8.5 by 11, fold the top left comer down to a...
Fantastic news! We've Found the answer you've been seeking!
Transcribed Image Text:
Given a sheet of paper 8.5" by 11, fold the top left comer down to a point on the bottom edge. Where should you place this corner to maximize the area of the triangle formed in the bottom left corner? Remember, the area of a triangle can be given by the geometry formula: Area = This formula tells us that the area is a function of the and the of the triangle. Let's do some measuring (and calculating)) and determine the area for some triangles. Take a blank sheet of 8.5" by 11" piece of paper and (holding it sideways) mark the bottom edge and the left side of the paper in 0.5* units using a ruler. You only need to mark the bottom edge up to 8.5". Fold the top left corner down to the point on the bottom edge that measures 1". Estimate the height of the triangle to the nearest 0.1". Now calculate the area of the triangle. We are now going to let the base of the triangle grow longer. What will happen to the height of the triangle? What do you think will happen to the area of the triangle? Let's see if the above conjectures are correct. Fold the top left corner down to the indicated point (in the table below) on the bottom edge of the piece of paper. Estimate the height of each triangle (to the nearest 0.1 in). Then calculate the area of the triangle. Use the table below to show your results. Base Height Area Base Height Area 5" 2" 6″ 3" 7" 8° From your chart where does it appear that the maximum value of the area of the triangle occurs? The maximum area of the triangle is and it occurs when the base is To determine the exact value of the base that will maximize the area we need to write a function for the area in terms of the base. In order to do this we first need to write a function for the height of the triangle in terms of the base. (This is not easy!). Let's look at this data in graph form. Put the values of the base in L1 and the values of the height in L2. Turn on Plot 1 from your Stat Plot menu and select the scatterplot option. Set up your window to get a good view of your data points and plot the data. Draw a diagram of the data points below and indicate the window you used on your calculator. Dxonin Xmax): Exmoin. Ymax): What type of function do you think your data matches the closest? Using the regression option see if your guess was correct? Graph your regression equation. How does it fit? Let's try to find this relationship algebraically. (Remember, this is the relationship between the height of the triangle and the base of the triangle.) Draw a diagram of the paper with the top left corner folded down (similar to the figure on the other side). Label the base of the triangle B. Label the height of the triangle H. What is the length of the hypotenuse of the triangle? Your answer should be in terms of H, not B. (Hint: Unfold your paper!) Hypotenuse Use the Pythagorean Theorem and write an equation which shows the relationship among these three sides. .)² Solve this equation for H. H = Put the equation that you found for H into Y1 and graph it. You will be letting "x" represent the variable "B" and "y" represent the variable "H". Does it fit your data points? It should if you found it correctly!) We are now ready to write our equation for the area of the triangle. The area of the triangle (in terms of the base B) is A = The independent variable is and the dependent variable is Before we graph this function let's change our data points in L2 to show the relationship between the base of the triangle and the area of the triangle. You have these values in your AREA column on the other side. Graph them and show your graph below. Now put your area equation in Y1 of your calculator and see how it fits your data. Hopefully it fits very well! Use your calculator to find the value of the base that maximizes the area of the triangle. | The maximum occurs when the base is and the height is T Given a sheet of paper 8.5" by 11, fold the top left comer down to a point on the bottom edge. Where should you place this corner to maximize the area of the triangle formed in the bottom left corner? Remember, the area of a triangle can be given by the geometry formula: Area = This formula tells us that the area is a function of the and the of the triangle. Let's do some measuring (and calculating)) and determine the area for some triangles. Take a blank sheet of 8.5" by 11" piece of paper and (holding it sideways) mark the bottom edge and the left side of the paper in 0.5* units using a ruler. You only need to mark the bottom edge up to 8.5". Fold the top left corner down to the point on the bottom edge that measures 1". Estimate the height of the triangle to the nearest 0.1". Now calculate the area of the triangle. We are now going to let the base of the triangle grow longer. What will happen to the height of the triangle? What do you think will happen to the area of the triangle? Let's see if the above conjectures are correct. Fold the top left corner down to the indicated point (in the table below) on the bottom edge of the piece of paper. Estimate the height of each triangle (to the nearest 0.1 in). Then calculate the area of the triangle. Use the table below to show your results. Base Height Area Base Height Area 5" 2" 6″ 3" 7" 8° From your chart where does it appear that the maximum value of the area of the triangle occurs? The maximum area of the triangle is and it occurs when the base is To determine the exact value of the base that will maximize the area we need to write a function for the area in terms of the base. In order to do this we first need to write a function for the height of the triangle in terms of the base. (This is not easy!). Let's look at this data in graph form. Put the values of the base in L1 and the values of the height in L2. Turn on Plot 1 from your Stat Plot menu and select the scatterplot option. Set up your window to get a good view of your data points and plot the data. Draw a diagram of the data points below and indicate the window you used on your calculator. Dxonin Xmax): Exmoin. Ymax): What type of function do you think your data matches the closest? Using the regression option see if your guess was correct? Graph your regression equation. How does it fit? Let's try to find this relationship algebraically. (Remember, this is the relationship between the height of the triangle and the base of the triangle.) Draw a diagram of the paper with the top left corner folded down (similar to the figure on the other side). Label the base of the triangle B. Label the height of the triangle H. What is the length of the hypotenuse of the triangle? Your answer should be in terms of H, not B. (Hint: Unfold your paper!) Hypotenuse Use the Pythagorean Theorem and write an equation which shows the relationship among these three sides. .)² Solve this equation for H. H = Put the equation that you found for H into Y1 and graph it. You will be letting "x" represent the variable "B" and "y" represent the variable "H". Does it fit your data points? It should if you found it correctly!) We are now ready to write our equation for the area of the triangle. The area of the triangle (in terms of the base B) is A = The independent variable is and the dependent variable is Before we graph this function let's change our data points in L2 to show the relationship between the base of the triangle and the area of the triangle. You have these values in your AREA column on the other side. Graph them and show your graph below. Now put your area equation in Y1 of your calculator and see how it fits your data. Hopefully it fits very well! Use your calculator to find the value of the base that maximizes the area of the triangle. | The maximum occurs when the base is and the height is T
Expert Answer:
Answer rating: 100% (QA)
Sol Given that Area xBxH ie area is fanction of and hight of the base the 4 from t... View the full answer

Related Book For 

Posted Date:
Students also viewed these finance questions
-
For both qualitative and quantitative data, what is the difference between the relative frequency and the percent frequency? The percent frequency equals the relative frequency multiplied by 100 a)...
-
A sheet of paper has length 27.95 cm, width 8.5 in., and thickness 0.10 mm. What is the volume of a sheet of paper in m3? (Volume = length width thickness.)
-
A boxer punches a sheet of paper in midair and brings it from rest up to a speed of 25 m/s in 0.05 s. (a) What acceleration is imparted to the paper? (b) If the mass of the paper is 0.003 kg, what...
-
Hi,Please answer no.5 and 6 only. This is my 3rd time to uploadthis question. Thank you so much! Bay Lake Mining Ltd. purchases earth-moving equipment on 1 August \( 20 \times 6 \) and signs a...
-
By a simple example demonstrate that it is possible that Fn n ( 1, are d.f.s of r.v.s with A d.f., but not that of a r.v. Fn = F,
-
The pace of change in our economy was frenetic from 1999 to 2001 (the so called dot-com boom) because of rapidly expanding technology and the growth of the Internet. Shortly thereafter, the bubble...
-
A symmetric [0/90/0] laminate is \(0.75 \mathrm{~mm}\) thick and its full compliance matrix is given below: where the units of the matrix are Determine the following effective engineering constants...
-
Pargo Corporation produces industrial robots for high-precision manufacturing. The following information is given for Pargo Corporation. The company has a desired ROI of 20%. It has invested assets...
-
IBM issued a 30-year $1,000 par value bond with 8% coupon rate 10 years ago. The coupons are paid semiannually. The bond is currently selling at 96% of its par value. What is the YTM on IBM's debt...
-
Imagine that you are Magna's new corporate controller and answer the following: 1. Describe Magna's strategy in terms of how it competes for customers. 2. Based on Magna's strategy and the data...
-
Apply the use of internal controls to the scenario below, then respond to the questions that follow: Ted Jones owns rental properties in Texas. Each property has a property manager, who collects the...
-
Purple Reign is a clothing manufacturer/retailer based in Minneapolis, MN. The company started by making and selling t-shirts with images of the musician Prince on them. Business picked up and the...
-
In 2 0 2 1 , Williams Sonoma reported total assets of $ 4 , 6 6 1 billion, total liabilities of $ 3 , 0 1 0 million, and common stock equity of $ 1 , 6 5 1 million. What was the firm's debt ratio in...
-
K Thao earned the following scores on her six management exams last semester. 77, 83, 41, 87, 77, 92 Find the mean, the median, and the mode for Thao's scores. The mean for Thao's scores is (Type an...
-
Sarah, Tim and Joe are in partnership. Adjusted profits for the year to 31 May 2023 are 300,000. Up to 31 October 2022, the partners share profits 35:30:35 after charging a salary for Tim of 12,000...
-
Solve the system. State whether the system is inconsistent or has infinitely many solutions. If the system has infinitely many solutions, write the solution set with y arbitrary. 3x-4y=4 -6x+8y=-8...
-
Required information Exercise 12-12 (Algo) Indirect: Preparing statement of cash flows LO P2, P3, A1 [The following information applies to the questions displayed below.] The following financial...
-
You continue to work in the corporate office for a nationwide convenience store franchise that operates nearly 10,000 stores. The per- store daily customer count (i.e., the mean number of customers...
-
Do we inadvertently alter the realities that we attempt to measure in a public opinion survey? Does Heisenberg's uncertainty principle apply here?
-
Although coal contains only minute quantities of radioactive materials, there is more radiation emitted by a coal-fired power plant than a fission power plant simply because ol the vast amount of...
-
Consider 50 g of hot water at 80C poured into a cavity in a very large block of ice at 0C. What will be the final temperature of the water in the cavity? Show that 50 g of ice must melt in order to...
-
Describe how the developed temptation analysis pattern would be stable over time.
-
List some of the testing patterns that can be applied for testing the temptation stable analysis pattern.
-
List some of the lessons learnt from the use of the stable analysis pattern for temptation.

Study smarter with the SolutionInn App