

Question: Given are five observations collected in a regression study on two variables. a. Which of the following scatter diagrams accurately represents the data? Scatter diagram
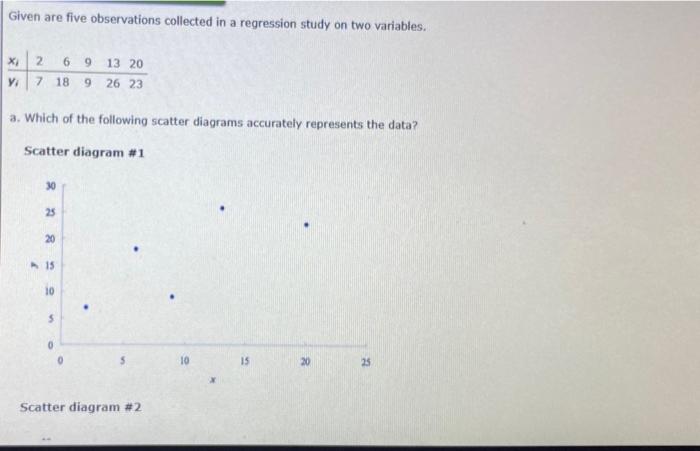
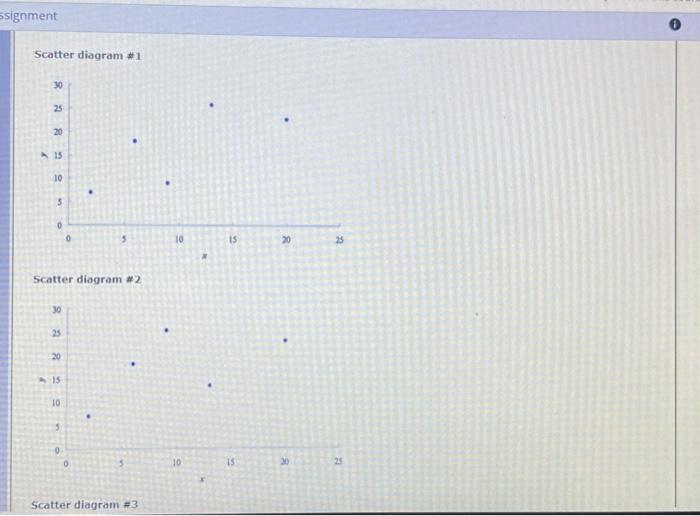
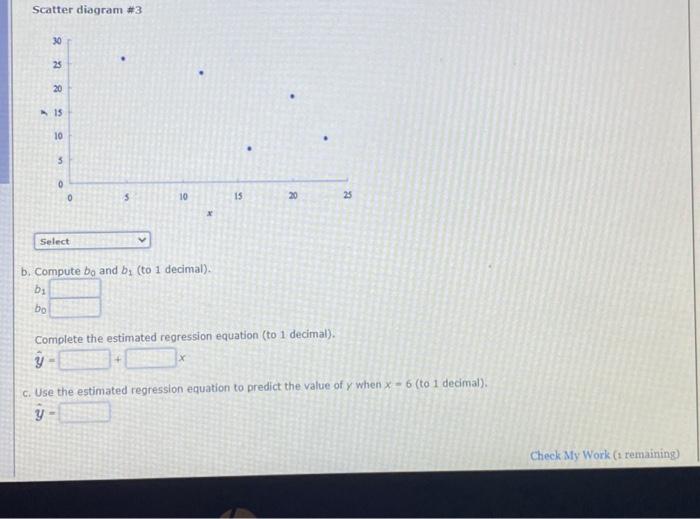
Given are five observations collected in a regression study on two variables. a. Which of the following scatter diagrams accurately represents the data? Scatter diagram \# 1 Scatter diagram \#1 Scatter diagram \#2 Scatter diagram \#3 b. Compute b0 and b1 (to 1 decimal). b1 b0 Complete the estimated regression equation (to 1 decimal). y^=
Step by Step Solution
There are 3 Steps involved in it
1 Expert Approved Answer
Step: 1 Unlock

Question Has Been Solved by an Expert!
Get step-by-step solutions from verified subject matter experts
Step: 2 Unlock
Step: 3 Unlock