

Question: Given are five observations for two variables, > and y. 4 10 14 17 5 19 9 27 20 Develop the 90% confidence and prediction
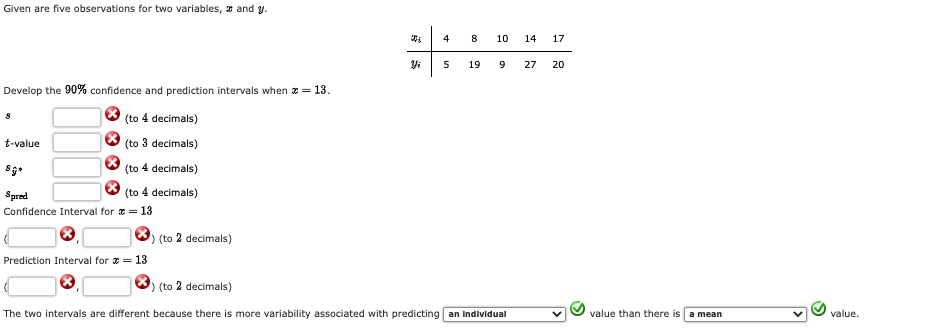
Given are five observations for two variables, > and y. 4 10 14 17 5 19 9 27 20 Develop the 90% confidence and prediction intervals when > = 13. S (to 4 decimals) t-value (to 3 decimals) (to 4 decimals) Spred (to 4 decimals) Confidence Interval for * = 13 ) (to 2 decimals) Prediction Interval for # = 13 ) (to 2 decimals) The two intervals are different because there is more variability associated with predicting |an individual value than there is a a mean v value
Step by Step Solution
There are 3 Steps involved in it
1 Expert Approved Answer
Step: 1 Unlock

Question Has Been Solved by an Expert!
Get step-by-step solutions from verified subject matter experts
Step: 2 Unlock
Step: 3 Unlock