

Question: Given are five observations for two variables, x and y. Xi-Height 68 64 62 65 66 Yi- Weight 132 108 102 115 128 a.
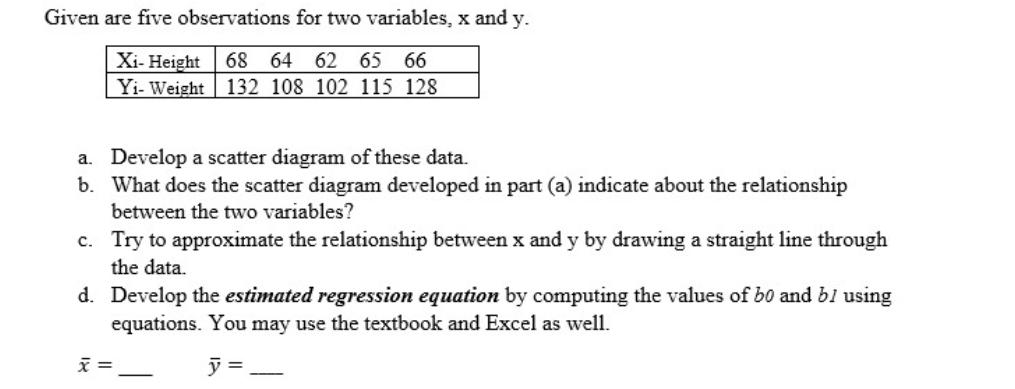
Given are five observations for two variables, x and y. Xi-Height 68 64 62 65 66 Yi- Weight 132 108 102 115 128 a. Develop a scatter diagram of these data. b. What does the scatter diagram developed in part (a) indicate about the relationship between the two variables? c. Try to approximate the relationship between x and y by drawing a straight line through the data. d. Develop the estimated regression equation by computing the values of 60 and 61 using equations. You may use the textbook and Excel as well. X= _ y =
Step by Step Solution
There are 3 Steps involved in it
1 Expert Approved Answer
Step: 1 Unlock

Question Has Been Solved by an Expert!
Get step-by-step solutions from verified subject matter experts
Step: 2 Unlock
Step: 3 Unlock