

Question: Given below are the sample means for fifteen samples consisting of five data values each. Assume that the mean of the sample means is ten
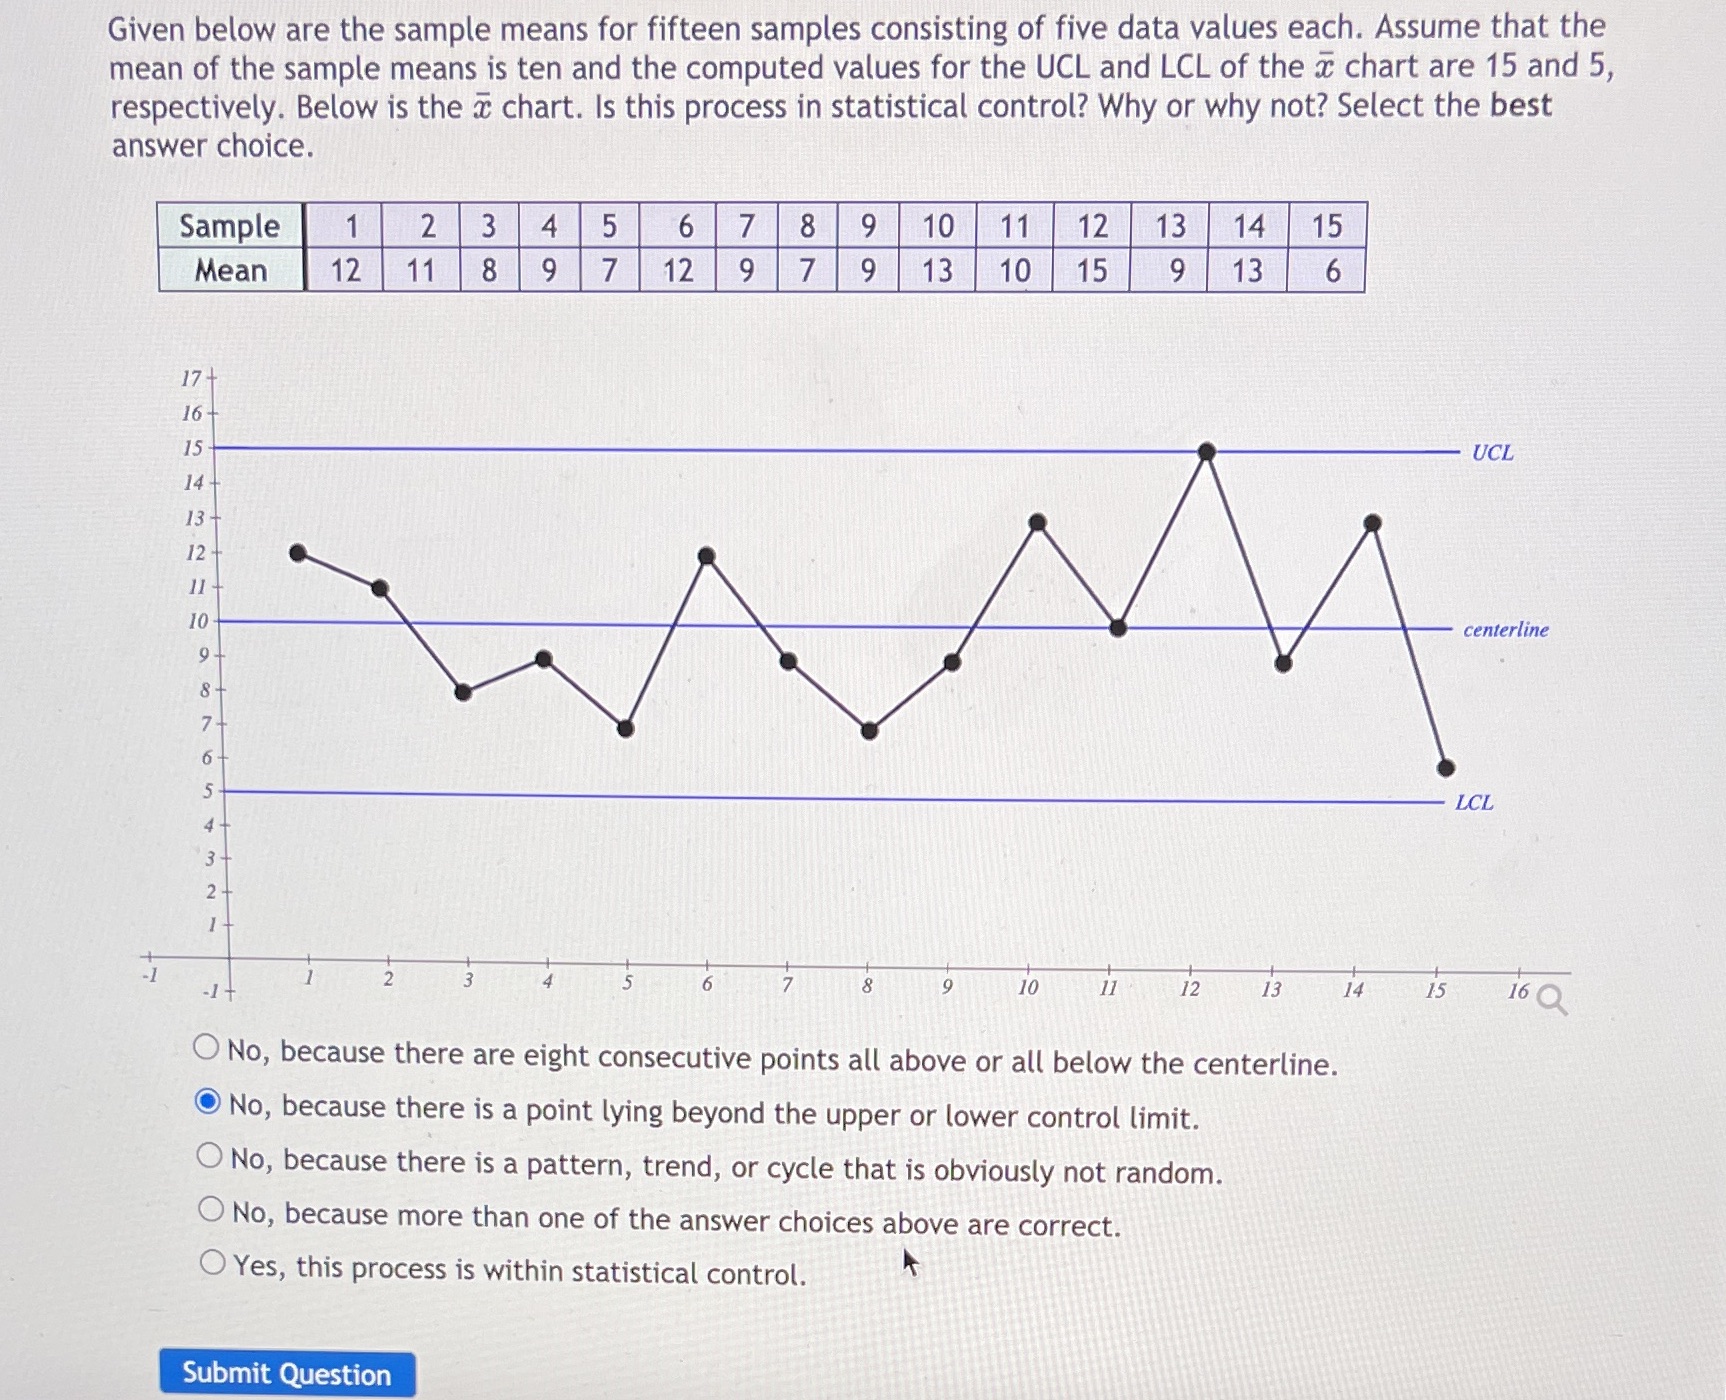
Given below are the sample means for fifteen samples consisting of five data values each. Assume that the mean of the sample means is ten and the computed values for the UCL and LCL of the a chart are 15 and 5, respectively. Below is the a chart. Is this process in statistical control? Why or why not? Select the best answer choice. Sample 2 3 4 5 6 7 8 9 10 11 12 13 14 15 Mean 12 11 8 9 7 12 9 7 9 13 10 15 9 13 6 17 16- 15 UCL 14 13 12 centerline LCL NWAU -1+ 10 11 12 13 14 15 16 Q O No, because there are eight consecutive points all above or all below the centerline. No, because there is a point lying beyond the upper or lower control limit. O No, because there is a pattern, trend, or cycle that is obviously not random. No, because more than one of the answer choices above are correct. O Yes, this process is within statistical control. Submit
Step by Step Solution
There are 3 Steps involved in it

Get step-by-step solutions from verified subject matter experts