

Question: Given below are three ratios calculated for three companies for the years 2011 and 2012. Dobson Co. Larson Co. Hawkins Co. Dec 31 1.8 2.2
Given below are three ratios calculated for three companies for the years 2011 and 2012.
Dobson Co.
Larson Co.
Hawkins Co.
Dec 31
1.8
2.2
2.3
1.5
2.8
2.0
2012
2011
Current Ratio
8.0 times
9.6 times
5.8 times
5.8 times
6.9 times
7.6 times
2012
2011
Inventory Turnover
0.5
1.2
2.1
1.4
2.5
1.0
2012
2011
Acid-test ratio
Answer the following questions:
1. Which company has the greatest percentage of inventory and prepaid? How can you tell?
2. Which company appears to be heading to the wrong direction concerning its ability to pay its current liabilities? Explain
3. Which company appears to be the most liquid? Explain.
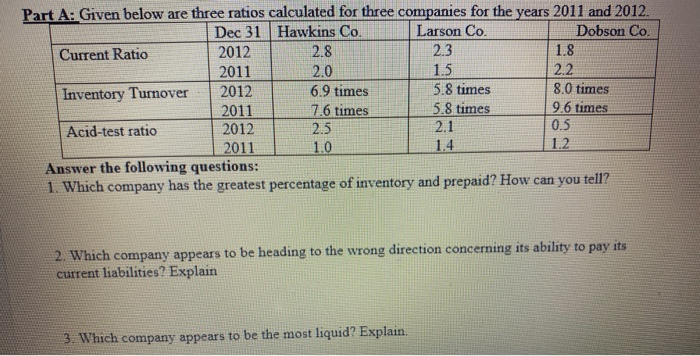
Part A: Given below are three ratios calculated for three companies for the years 2011 and 2012. Dec 31 Hawkins Co. Larson Co. Dobson Co. Current Ratio 2012 2.8 2.3 1.8 2011 2.0 1.5 2.2 Inventory Turnover 2012 6.9 times 5.8 times 8.0 times 2011 7.6 times 5.8 times 9.6 times Acid-test ratio 2012 2.5 2.1 2011 1.0 1.4 1.2 Answer the following questions: 1. Which company has the greatest percentage of inventory and prepaid? How can you tell? 0.5 2. Which company appears to be heading to the wrong direction concerning its ability to pay its current liabilities? Explain 3. Which company appears to be the most liquid? Explain
Step by Step Solution
There are 3 Steps involved in it
1 Expert Approved Answer
Step: 1 Unlock

Question Has Been Solved by an Expert!
Get step-by-step solutions from verified subject matter experts
Step: 2 Unlock
Step: 3 Unlock