

Question: Given below are three sets of axes: position versus time, velocity versus time and acceleration versus time. The velocity versus time graph shows the
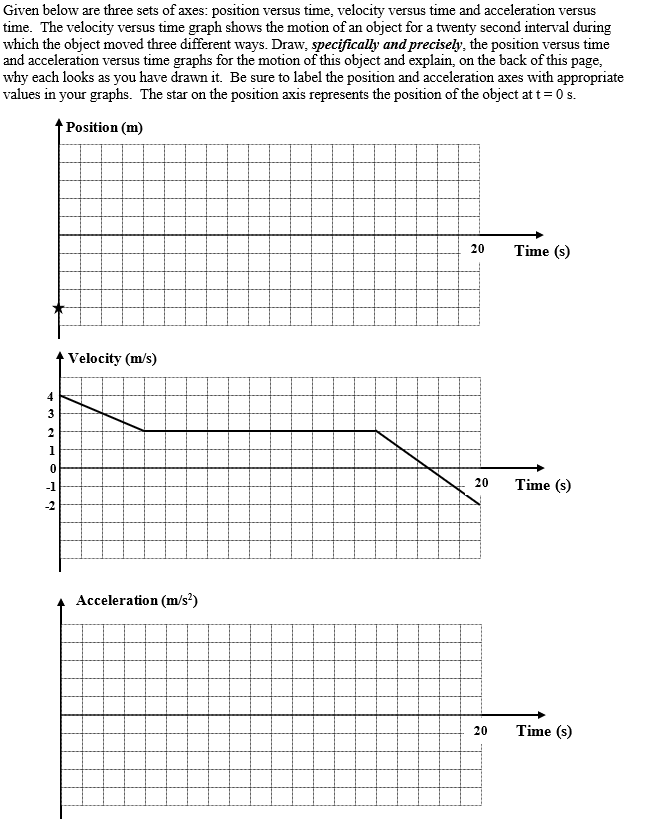
Given below are three sets of axes: position versus time, velocity versus time and acceleration versus time. The velocity versus time graph shows the motion of an object for a twenty second interval during which the object moved three different ways. Draw, specifically and precisely, the position versus time and acceleration versus time graphs for the motion of this object and explain, on the back of this page, why each looks as you have drawn it. Be sure to label the position and acceleration axes with appropriate values in your graphs. The star on the position axis represents the position of the object at t=0 s. Position (m) 4 3 INW 2 1 0 -1 -2 Velocity (m/s) Acceleration (m/s) 20 20 20 Time (s) Time (s) Time (s)
Step by Step Solution
There are 3 Steps involved in it
Solution i... View full answer

Get step-by-step solutions from verified subject matter experts