

Question: Given Data: begin{tabular}{|ll|l|l|} hline Jan.1 & Beginning inventory & 619 units @ $78=$48,282 hline Feb. 13 & Purchased & 335 units @ $75=$25,125
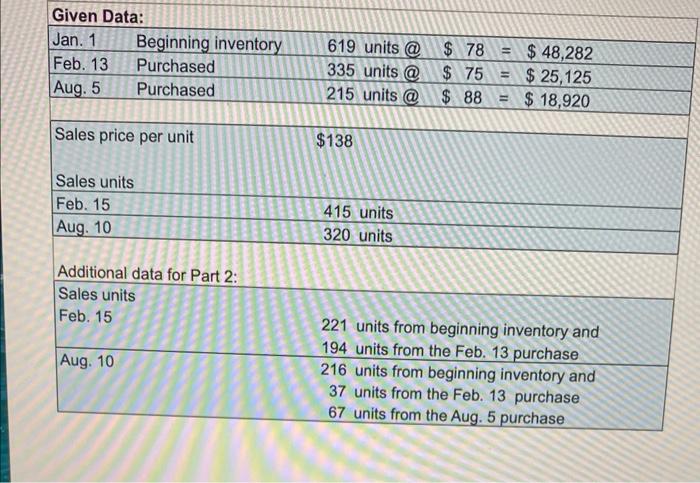
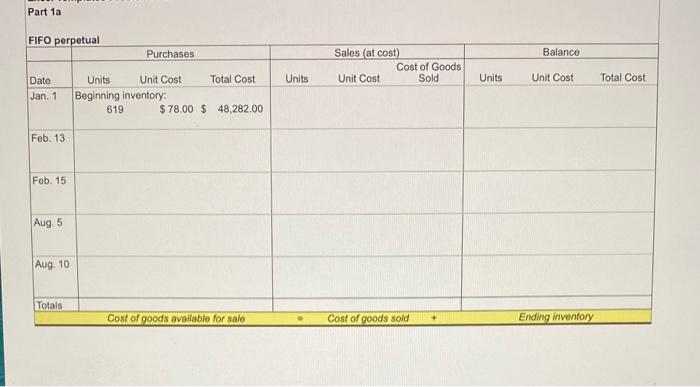
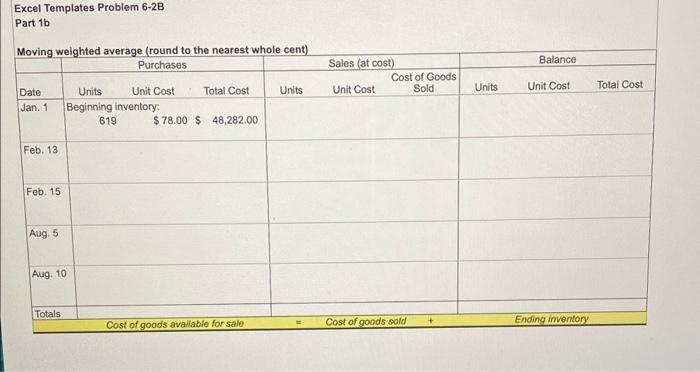
Given Data: \begin{tabular}{|ll|l|l|} \hline Jan.1 & Beginning inventory & 619 units @ $78=$48,282 \\ \hline Feb. 13 & Purchased & 335 units @ $75=$25,125 \\ \hline Aug. 5 & Purchased & 215 units @ $88=$18,920 \\ \hline \end{tabular} Sales price per unit $138 Sales units Feb. 15 415 units Aug. 10 320 units Additional data for Part 2: Sales units Feb. 15 221 units from beginning inventory and Aug. 10 194 units from the Feb. 13 purchase 216 units from beginning inventory and 37 units from the Feb. 13 purchase 67 units from the Aug. 5 purchase Part 1a FIFO perpetual Excel Templates Problem 6-2B Part 1b
Step by Step Solution
There are 3 Steps involved in it
1 Expert Approved Answer
Step: 1 Unlock

Question Has Been Solved by an Expert!
Get step-by-step solutions from verified subject matter experts
Step: 2 Unlock
Step: 3 Unlock