

Question: Given: Data relating to the types of bridge failure caused by hazard events were recorded over a period of 5 0 years and are shown
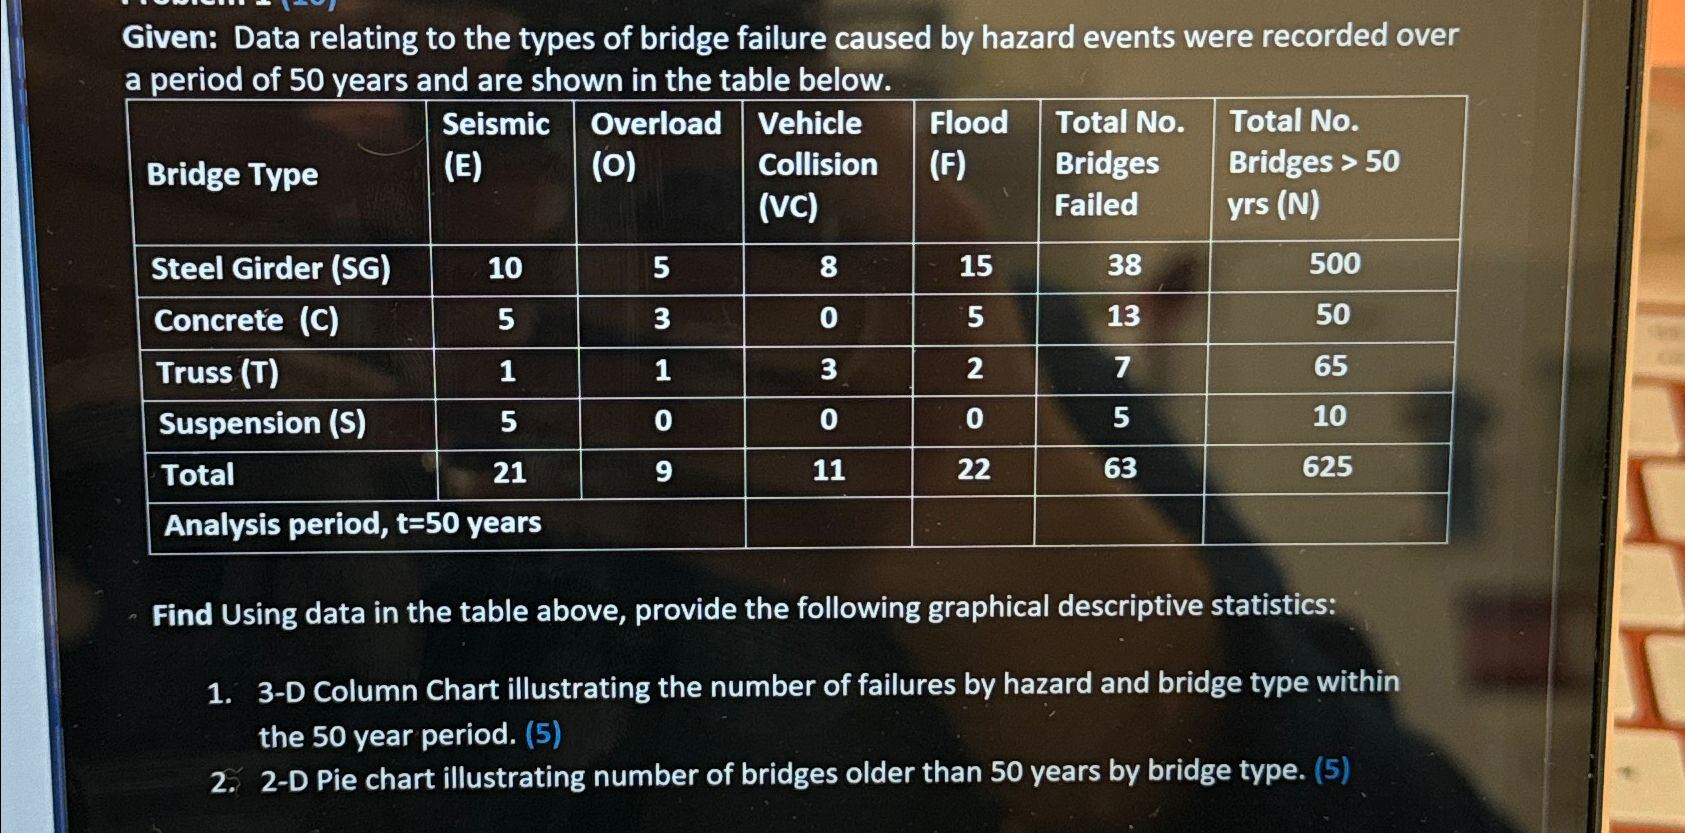
Given: Data relating to the types of bridge failure caused by hazard events were recorded over a period of years and are shown in the table below.
tableBridge Type,tableSeismicEtableOverloadOtableVehicleCollisionVCtableFloodFtableTotal NoBridgesFailedtableTotal NoBridges yrs NSteel Girder SGConcrete CTruss TSuspension STotalAnalysis period, t years,,,,,,
Find Using data in the table above, provide the following graphical descriptive statistics:
D Column Chart illustrating the number of failures by hazard and bridge type within the year period.
D Pie chart illustrating number of bridges older than years by bridge type.
Step by Step Solution
There are 3 Steps involved in it
1 Expert Approved Answer
Step: 1 Unlock

Question Has Been Solved by an Expert!
Get step-by-step solutions from verified subject matter experts
Step: 2 Unlock
Step: 3 Unlock