

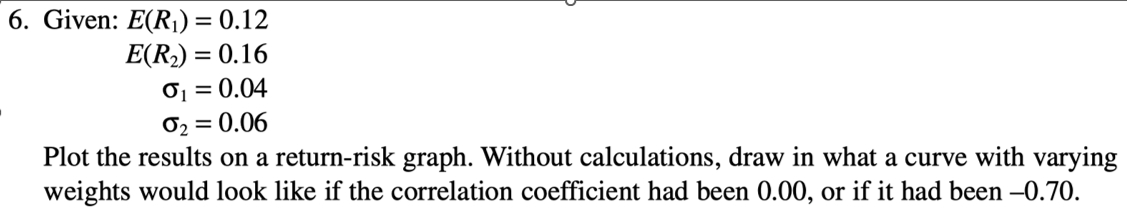
Question: Given: E ( R 1 ) = 0 . 1 2 E ( R 2 ) = 0 . 1 6 1 = 0 .
Given:
Plot the results on a returnrisk graph. Without calculations, draw in what a curve with varying
weights would look like if the correlation coefficient had been or if it had been
Step by Step Solution
There are 3 Steps involved in it
1 Expert Approved Answer
Step: 1 Unlock

Question Has Been Solved by an Expert!
Get step-by-step solutions from verified subject matter experts
Step: 2 Unlock
Step: 3 Unlock