

Question: given info for you: answer these questions for a thumbs up!: Actual Actual 2016 Aca 2017 Act 2018 Actual 2020 2010 Forecast 2011 Forecast Fernant
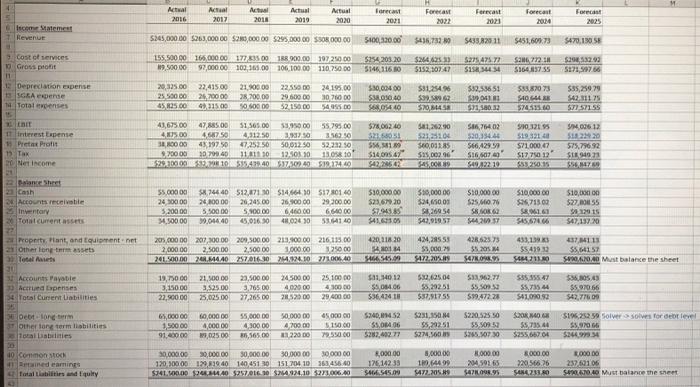
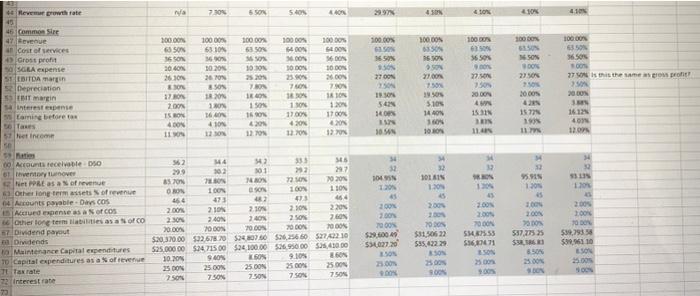
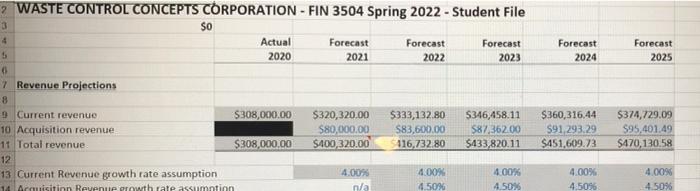
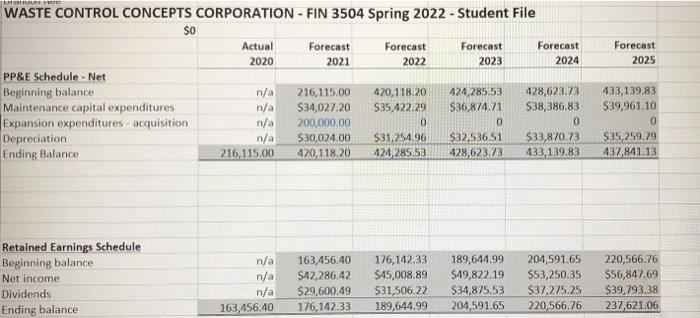
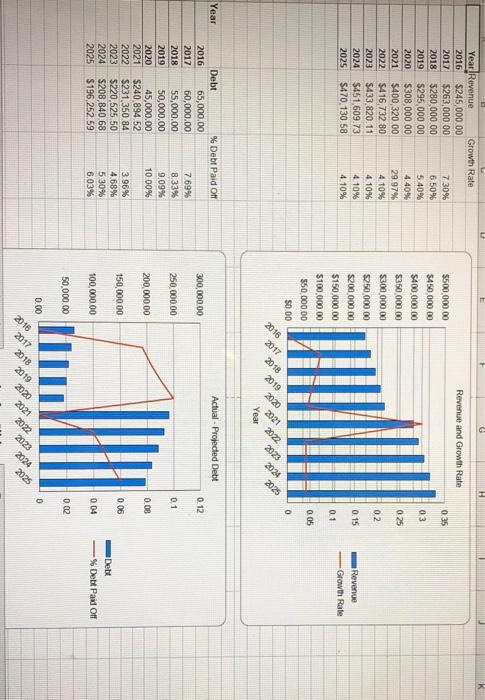
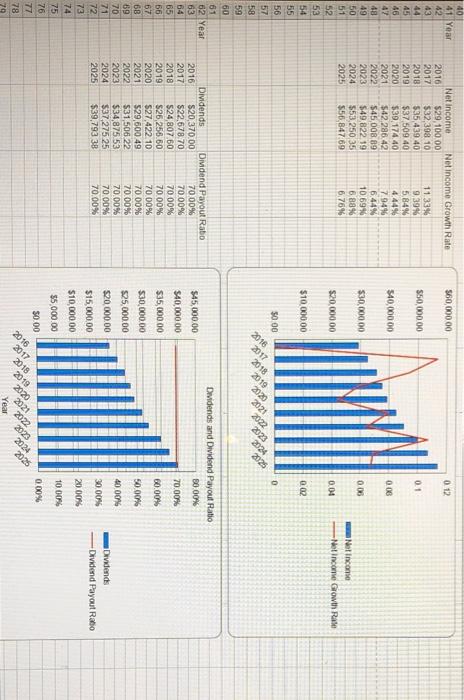
Actual Actual 2016 Aca 2017 Act 2018 Actual 2020 2010 Forecast 2011 Forecast Fernant 2021 2022 Forecast 2004 Forecast 2025 Income Statement RE $245,000.00 $763,000.00 $20,000.00 $295,000.00 $30800000 5400,320.00 $436.732.00 5433,829 11 $451,507.73 $470.130 IS 155,500 00 165.000.0017223500188 900.00197250.00 97,000.00 109.169.00 106.100.00 110.750.00 5154203.20 5146.116.30 00 OSH $26462513 $352, 07:47 $275475.72 $153 TUZTES $39053293 517159756 $164.43755 Cost of services Gross profit 11 Depreciation expense GEA werde 14 Totalenses 20,325.00 25.500.00 45.225.00 $35,289 29 22,41500 26,700.00 4,31500 21, 10000 28200.00 22550 29 600 00 32.150 DO 24 195.00 30 70000 549.00 $30,00400 $3803040 SA0440 5312546 $99, 962 520 MS $32,53651 $32001 $33.87073 S40 4 000090 OF SPES 571-57155 57806240 55 TCE OS T0523 Interest Expense 11 Pretat Profit 12 Tax Net income 41,675.00 47,885.00 51.565.00 33.950.00 55.795.00 405.00 467.50 4,312.50 3.93250 356350 30000 43 1970 47,25250 50,612.50 52.222.50 520000 10.2004 11.1110 12.50% 10 1305 10 $29.800001515411.4057302.40.519.1449 $81,2620 52123100 $60,00185 5176402 520,95445 566.429.99 556, 119 51447" 519 320 $71.000.07 S12 2012 SN 09612 5220 575,79692 SLE 940 0 0915 960'sts GROOS $49.22.10 Balance Sheet 20 Cash Accounts receivable Inventory Tort current assets 55.000.00 24 30000 5.2000 54,80000 $8.744 40 512,8713051466410 517 30140 20,10000 26,245.00 26,900.00 29 200.00 5.100.00 6460.00 654000 99.046.40 6,036 50 41,024 10 53.140 550.000.00 523.6.20 5784385 SA1.03.08 380,00000 324,500 926054 S42019 SE $10.000.00 $25,4074 SOK SA 20937 $10,000.00 $26.713.00 2016 SAS 67866 $10,000100 $27,055 OU DOGS ST BE 547,137 20 420, 218 20 ESSERE Property Plant, and Equipment.net Other long assets Total 205,20000 207,300.00 209,500.00 210.90000 216.135.00 2,000.00 2.500.00 2,500.00 3.000.00 325000 201.500.00 20.144.4025701604224.107710040 BETON $5,000 $422.05.09 42852573 $50 $47.0 433,139 $5419 SAHA 3.0 337,113 5564157 5920.4.20,00 Must balance the sheet 19,000 3,150.00 27,900.00 21.500.00 3.525.00 23,025.00 23,500.00 2.265.00 27,26500 2450000 4.029.00 25.10000 4300.00 29 400.00 $31.540 12 S408406 $36.4348 582.625.04 $5,292.51 $32.91755 51.62.77 $5.500 $19,472 28 $35,355 47 SSS 44 S41.090. $36,805 $597066 $42.77609 00 CS s Accounts Payable Actua perses 38 Total Current Liabilities 0 Debt long term 3. Other tone termiabilities Total Lasties DO 19 Commons ned emines Total abilities and Equity 65,000.00 150000 91.600.00 10,000.00 400000 9,02500 55.000 DO 4,300.00 21,565.00 50.00000 4700.00 1220.00 450000 $150.00 79.590.00 $340,452 SOBA 06 5287.492.77 $231,150 $5.29251 $274,56039 $220.525 50 55,509 57 $20 55,735 44 3255,667.04 $196,252 9 Solver solves for der level $5,906 $24.95 06. Os 30.000.00 30,000.00 30,000.00 50,000.00 30,000.00 130 30000 129, 1940 140,451 015120410161456.40 $141.100.00 USD $27006 00244924.10 223.006.40 2,000.00 12614233 St. 545.09 8,000.00 1.64499 5472.205 1.000.00 204,59365 S47098.95 8.000.00 22056626 SON 1.000.00 23700106 S470.40 Must balance the sweet va 7.30 5 SON 54 LAN 4 41 an 100 100 BON 100 BON 10000 10000 63 10 1000 63 Son 100.00% 4350 NOSE NOS 19 300 ON 6S SON 16 200 26100 100 62 36 Son VOG 100 DON SON ON 30 DON 23.09 WO WS 16.SON VOS NE OF NOS 10 Revem growth rate 45 45. Common Sire 47. ve Cost of vices Gross prot SOLA expense 51 LTDA Depreciation Tarin interest expense Caming before to sas 57 Reino so NOS DON 220 SON 2700 50 US NS LE 3650 son 27 Is this the same pro 21.00 30 20 26 PM SON 18 MO VE VE NOVE MOGE SO . 3.500 20 BON 4 NES 20 N NOT WOST 2000N 4 MORE 13 510 WE 17 RON 2001 ISBON 400N 1810 120 1700 60 1 16 NOCE 54 SON 30. WAT NUEST NE 1440N 160 10 RON NELST WE 4101 1612 40 12.00 12 VIT SETT 11 11 w 34 32 2 30 EK 32 101 IN NON N1856 13 NOWO Sot 110 WOT 104N 1201 45 2008 2.00 45 NO NOT 2009 NONE NOOT 0 Accounts receivables 562 14 12 345 They over 102 101 Pats of revenue 70 2 19 20% Other long term sets of revenue Son 110N 04 Accounts payable - Day COS 464 473 425 464 Accuedense as ao COS 2007 210N 2.100 20 220 Other long termes as a CO 20 24N 240W 250 7 Dividend payout 20OON 7000N 70.COM 20OON 0 0 Dividends $20.370.00 5926780 S4060 526,25660527102 10 Maintenance Capital expenditures 525.00000574 75 00 34 100.00 95000 59.410.00 TO Capital expenditures as a free 100 9.ON SON 9.10 SON TL Tax rate 25 DON 25.00% 2500N 2500 SON 22 Interest rate 7.50 7.50N 7. SON 7.500 2.00 70 ON NO SMS 09 WORDS / 05 130 70DN $33,506 22 $95.62229 SON 29.000 S42720 50 DO 537,77525 $32.16 8.50 $561471 100 $39.93 $30,66110 E SON 5005 NOS LOOT NOUS 006 SON Forecast 2024 Forecast 2025 2 WASTE CONTROL CONCEPTS CORPORATION - FIN 3504 Spring 2022 - Student File 3 SO 4 Actual Forecast Forecast Forecast 5 2020 2021 2022 2023 0 7 Revenue Projections 8 9 Current revenue $308,000.00 $320,320.00 $333,132.80 $346,458.11 10 Acquisition revenue $80,000.00 583,600.00 $87,362.00 11 Total revenue $308,000.00 $400 320.00 116,732.80 $133,820.11 12 13 Current Revenue growth rate assumption 4.00% 4.00% 4.00% 1 Arauisition Revenue growth rate assumption n/a 4.50% 4.50 $360,316.44 91,293.29 $451.609.73 $374,729.09 $95,401.49 $470,130,58 4.00% 4.5096 4.00% 4.50% WASTE CONTROL CONCEPTS CORPORATION - FIN 3504 Spring 2022 - Student File $0 Actual 2020 Forecast 2021 Forecast 2022 Forecast 2023 Forecast 2024 Forecast 2025 PP&E Schedule - Net Beginning balance Maintenance capital expenditures Expansion expenditures acquisition Depreciation Ending Balance n/a n/a n/a n/a 216,115.00 216,115,00 $34,027.20 200,000.00 $30,024.00 420,118.20 420,118.20 $35,422.29 0 $31.254.96 424,285.53 424,285.53 $36,874.71 0 $32,536,51 428,623.73 428,623.73 $38,386.83 0 $33,870.73 433,139.83 433,139.83 $39,961.10 0 $35,259.79 437,841.13 Retained Earnings Schedule Beginning balance Net income Dividends Ending balance n/a n/a n/a 163,456.40 163,456.40 $42,286.42 $29,600.49 176,142.33 176,142.33 $45,008.89 $31,506,22 189,644.99 189,644.99 $49,822.19 $34,875.53 204,591.65 204,591.65 $53,250.35 $37,275.25 220,566.76 220,566.76 $56,847.69 $39,793.38 237,621.06 H K Revenue and Growth Rate 035 0.3 Year Revenue Growth Rate 2016 $245,000.00 2017 $263,000.00 7 30% 2018 $280,000.00 6.50% 2019 $295,000.00 5.40% 2020 $308,000.00 4.40% 2021 $400 320.00 29.97% 2022 $416,732 80 4 10% 2023 $433,820.11 4. 10% 2024 $451.609.73 4 10% 2025 $470.130.58 4.10% 025 02 $500,000.00 $450,000.00 $400,000.00 $350,000.00 $300,000.00 $250,000.00 5200,000.00 $150,000.00 $100,000.00 550,000.00 50.00 0.15 Revenue Growth Rate 0 1 0.05 2018 2017 2016 2025 2024 2023 2022 2021 2020 0 2019 Year Year Actual Projected Debt 300,000.00 0.12 250,000.00 01 Debt % Debt Paid Of 2016 65,000.00 2017 60,000.00 7.6996 2018 55,000.00 8.33% 2019 50,000.00 9.09% 2020 45,000.00 10.00% $240,894,52 2022 $231,350.84 3.96% 2023 5220,525.50 4.68% 2024 $208,840.68 5 30% 2025 $196 25259 6.03% 200,000.00 0.08 2021 150,000.00 0.06 Dett % De Paid Off 100,000.00 0 04 50,000.00 0.02 2022 2021 2020 2019 2018 2017 0.00 2023 2024 2016 40 41 Year $60,000.00 0.12 43 550,000.00 01 Net income Net income Growth Rate 2016 $29,100.00 2017 $32,398 10 11 33% 2018 $35,439 40 9.39% 2019 $37 509 40 5,84% 2020 $39, 174.40 4,44% 2021 $42.286.42 7.94% 2022 $45,008.89 6.44% 2023 $49,822 19 10.69% 2024 553,250 35 6.88% 2025 $56,847.69 6.76% $10,000 00 0.06 $30,000.00 0.06 Netcon -Net income Growth Rae $20,000.00 0.04 $10,000.00 0.02 2022 2019 2020 2021 2016 2017 2018 50 00 0 2024 RO 2023 44 45 46 47 48 49 50 51 52 53 54 55 56 57 58 59 50 61 62 Year 63 64 65 56 67 6B 69 70 71 72 73 74 75 76 77 78 179 Dividends and Dividend Payout Ratio 80.00% $45,000.00 70.00% 60.00% Dividends Dividend Payout Rabo 2016 $20,370.00 70.00% 2017 $22,678.70 70.00% 2018 $24,807,60 70.00% 2019 $26,256 60 70 00% 2020 527,422.10 70 00% 2021 $29,600 49 70.00% 2022 $31,506 22 70.00% 2023 $34,875 53 70.00% 2024 $37,275 25 70 00% 2025 $39,793 38 70.00% 50.00% $40,00000 $35,000.00 $30,000.00 $25,000.00 $20.000,00 $15,000.00 $10,000.00 $5,000.00 40 00 30.00% Dividends -Dividend Payout Ratio 20.00% 2024 2025 2022 2023 2020 2021 2018 2019 10.00% 50.00 0.00% 2016 2017 Year . Do you think the lender would have any concerns with WCC keeping the same dividend payout ratio after the acquisition? Provide an explanation Based on 2021, explain if WCC is more or less leveraged, than the competitors. Management has indicated that a multiple of 10X EBITDA is reasonable to value the invested capital of WCc. Explain if and why shareholder value has been created or reduced from the acquisition when comparing the 2020 value per share to the 2021 value . per share. Actual Actual 2016 Aca 2017 Act 2018 Actual 2020 2010 Forecast 2011 Forecast Fernant 2021 2022 Forecast 2004 Forecast 2025 Income Statement RE $245,000.00 $763,000.00 $20,000.00 $295,000.00 $30800000 5400,320.00 $436.732.00 5433,829 11 $451,507.73 $470.130 IS 155,500 00 165.000.0017223500188 900.00197250.00 97,000.00 109.169.00 106.100.00 110.750.00 5154203.20 5146.116.30 00 OSH $26462513 $352, 07:47 $275475.72 $153 TUZTES $39053293 517159756 $164.43755 Cost of services Gross profit 11 Depreciation expense GEA werde 14 Totalenses 20,325.00 25.500.00 45.225.00 $35,289 29 22,41500 26,700.00 4,31500 21, 10000 28200.00 22550 29 600 00 32.150 DO 24 195.00 30 70000 549.00 $30,00400 $3803040 SA0440 5312546 $99, 962 520 MS $32,53651 $32001 $33.87073 S40 4 000090 OF SPES 571-57155 57806240 55 TCE OS T0523 Interest Expense 11 Pretat Profit 12 Tax Net income 41,675.00 47,885.00 51.565.00 33.950.00 55.795.00 405.00 467.50 4,312.50 3.93250 356350 30000 43 1970 47,25250 50,612.50 52.222.50 520000 10.2004 11.1110 12.50% 10 1305 10 $29.800001515411.4057302.40.519.1449 $81,2620 52123100 $60,00185 5176402 520,95445 566.429.99 556, 119 51447" 519 320 $71.000.07 S12 2012 SN 09612 5220 575,79692 SLE 940 0 0915 960'sts GROOS $49.22.10 Balance Sheet 20 Cash Accounts receivable Inventory Tort current assets 55.000.00 24 30000 5.2000 54,80000 $8.744 40 512,8713051466410 517 30140 20,10000 26,245.00 26,900.00 29 200.00 5.100.00 6460.00 654000 99.046.40 6,036 50 41,024 10 53.140 550.000.00 523.6.20 5784385 SA1.03.08 380,00000 324,500 926054 S42019 SE $10.000.00 $25,4074 SOK SA 20937 $10,000.00 $26.713.00 2016 SAS 67866 $10,000100 $27,055 OU DOGS ST BE 547,137 20 420, 218 20 ESSERE Property Plant, and Equipment.net Other long assets Total 205,20000 207,300.00 209,500.00 210.90000 216.135.00 2,000.00 2.500.00 2,500.00 3.000.00 325000 201.500.00 20.144.4025701604224.107710040 BETON $5,000 $422.05.09 42852573 $50 $47.0 433,139 $5419 SAHA 3.0 337,113 5564157 5920.4.20,00 Must balance the sheet 19,000 3,150.00 27,900.00 21.500.00 3.525.00 23,025.00 23,500.00 2.265.00 27,26500 2450000 4.029.00 25.10000 4300.00 29 400.00 $31.540 12 S408406 $36.4348 582.625.04 $5,292.51 $32.91755 51.62.77 $5.500 $19,472 28 $35,355 47 SSS 44 S41.090. $36,805 $597066 $42.77609 00 CS s Accounts Payable Actua perses 38 Total Current Liabilities 0 Debt long term 3. Other tone termiabilities Total Lasties DO 19 Commons ned emines Total abilities and Equity 65,000.00 150000 91.600.00 10,000.00 400000 9,02500 55.000 DO 4,300.00 21,565.00 50.00000 4700.00 1220.00 450000 $150.00 79.590.00 $340,452 SOBA 06 5287.492.77 $231,150 $5.29251 $274,56039 $220.525 50 55,509 57 $20 55,735 44 3255,667.04 $196,252 9 Solver solves for der level $5,906 $24.95 06. Os 30.000.00 30,000.00 30,000.00 50,000.00 30,000.00 130 30000 129, 1940 140,451 015120410161456.40 $141.100.00 USD $27006 00244924.10 223.006.40 2,000.00 12614233 St. 545.09 8,000.00 1.64499 5472.205 1.000.00 204,59365 S47098.95 8.000.00 22056626 SON 1.000.00 23700106 S470.40 Must balance the sweet va 7.30 5 SON 54 LAN 4 41 an 100 100 BON 100 BON 10000 10000 63 10 1000 63 Son 100.00% 4350 NOSE NOS 19 300 ON 6S SON 16 200 26100 100 62 36 Son VOG 100 DON SON ON 30 DON 23.09 WO WS 16.SON VOS NE OF NOS 10 Revem growth rate 45 45. Common Sire 47. ve Cost of vices Gross prot SOLA expense 51 LTDA Depreciation Tarin interest expense Caming before to sas 57 Reino so NOS DON 220 SON 2700 50 US NS LE 3650 son 27 Is this the same pro 21.00 30 20 26 PM SON 18 MO VE VE NOVE MOGE SO . 3.500 20 BON 4 NES 20 N NOT WOST 2000N 4 MORE 13 510 WE 17 RON 2001 ISBON 400N 1810 120 1700 60 1 16 NOCE 54 SON 30. WAT NUEST NE 1440N 160 10 RON NELST WE 4101 1612 40 12.00 12 VIT SETT 11 11 w 34 32 2 30 EK 32 101 IN NON N1856 13 NOWO Sot 110 WOT 104N 1201 45 2008 2.00 45 NO NOT 2009 NONE NOOT 0 Accounts receivables 562 14 12 345 They over 102 101 Pats of revenue 70 2 19 20% Other long term sets of revenue Son 110N 04 Accounts payable - Day COS 464 473 425 464 Accuedense as ao COS 2007 210N 2.100 20 220 Other long termes as a CO 20 24N 240W 250 7 Dividend payout 20OON 7000N 70.COM 20OON 0 0 Dividends $20.370.00 5926780 S4060 526,25660527102 10 Maintenance Capital expenditures 525.00000574 75 00 34 100.00 95000 59.410.00 TO Capital expenditures as a free 100 9.ON SON 9.10 SON TL Tax rate 25 DON 25.00% 2500N 2500 SON 22 Interest rate 7.50 7.50N 7. SON 7.500 2.00 70 ON NO SMS 09 WORDS / 05 130 70DN $33,506 22 $95.62229 SON 29.000 S42720 50 DO 537,77525 $32.16 8.50 $561471 100 $39.93 $30,66110 E SON 5005 NOS LOOT NOUS 006 SON Forecast 2024 Forecast 2025 2 WASTE CONTROL CONCEPTS CORPORATION - FIN 3504 Spring 2022 - Student File 3 SO 4 Actual Forecast Forecast Forecast 5 2020 2021 2022 2023 0 7 Revenue Projections 8 9 Current revenue $308,000.00 $320,320.00 $333,132.80 $346,458.11 10 Acquisition revenue $80,000.00 583,600.00 $87,362.00 11 Total revenue $308,000.00 $400 320.00 116,732.80 $133,820.11 12 13 Current Revenue growth rate assumption 4.00% 4.00% 4.00% 1 Arauisition Revenue growth rate assumption n/a 4.50% 4.50 $360,316.44 91,293.29 $451.609.73 $374,729.09 $95,401.49 $470,130,58 4.00% 4.5096 4.00% 4.50% WASTE CONTROL CONCEPTS CORPORATION - FIN 3504 Spring 2022 - Student File $0 Actual 2020 Forecast 2021 Forecast 2022 Forecast 2023 Forecast 2024 Forecast 2025 PP&E Schedule - Net Beginning balance Maintenance capital expenditures Expansion expenditures acquisition Depreciation Ending Balance n/a n/a n/a n/a 216,115.00 216,115,00 $34,027.20 200,000.00 $30,024.00 420,118.20 420,118.20 $35,422.29 0 $31.254.96 424,285.53 424,285.53 $36,874.71 0 $32,536,51 428,623.73 428,623.73 $38,386.83 0 $33,870.73 433,139.83 433,139.83 $39,961.10 0 $35,259.79 437,841.13 Retained Earnings Schedule Beginning balance Net income Dividends Ending balance n/a n/a n/a 163,456.40 163,456.40 $42,286.42 $29,600.49 176,142.33 176,142.33 $45,008.89 $31,506,22 189,644.99 189,644.99 $49,822.19 $34,875.53 204,591.65 204,591.65 $53,250.35 $37,275.25 220,566.76 220,566.76 $56,847.69 $39,793.38 237,621.06 H K Revenue and Growth Rate 035 0.3 Year Revenue Growth Rate 2016 $245,000.00 2017 $263,000.00 7 30% 2018 $280,000.00 6.50% 2019 $295,000.00 5.40% 2020 $308,000.00 4.40% 2021 $400 320.00 29.97% 2022 $416,732 80 4 10% 2023 $433,820.11 4. 10% 2024 $451.609.73 4 10% 2025 $470.130.58 4.10% 025 02 $500,000.00 $450,000.00 $400,000.00 $350,000.00 $300,000.00 $250,000.00 5200,000.00 $150,000.00 $100,000.00 550,000.00 50.00 0.15 Revenue Growth Rate 0 1 0.05 2018 2017 2016 2025 2024 2023 2022 2021 2020 0 2019 Year Year Actual Projected Debt 300,000.00 0.12 250,000.00 01 Debt % Debt Paid Of 2016 65,000.00 2017 60,000.00 7.6996 2018 55,000.00 8.33% 2019 50,000.00 9.09% 2020 45,000.00 10.00% $240,894,52 2022 $231,350.84 3.96% 2023 5220,525.50 4.68% 2024 $208,840.68 5 30% 2025 $196 25259 6.03% 200,000.00 0.08 2021 150,000.00 0.06 Dett % De Paid Off 100,000.00 0 04 50,000.00 0.02 2022 2021 2020 2019 2018 2017 0.00 2023 2024 2016 40 41 Year $60,000.00 0.12 43 550,000.00 01 Net income Net income Growth Rate 2016 $29,100.00 2017 $32,398 10 11 33% 2018 $35,439 40 9.39% 2019 $37 509 40 5,84% 2020 $39, 174.40 4,44% 2021 $42.286.42 7.94% 2022 $45,008.89 6.44% 2023 $49,822 19 10.69% 2024 553,250 35 6.88% 2025 $56,847.69 6.76% $10,000 00 0.06 $30,000.00 0.06 Netcon -Net income Growth Rae $20,000.00 0.04 $10,000.00 0.02 2022 2019 2020 2021 2016 2017 2018 50 00 0 2024 RO 2023 44 45 46 47 48 49 50 51 52 53 54 55 56 57 58 59 50 61 62 Year 63 64 65 56 67 6B 69 70 71 72 73 74 75 76 77 78 179 Dividends and Dividend Payout Ratio 80.00% $45,000.00 70.00% 60.00% Dividends Dividend Payout Rabo 2016 $20,370.00 70.00% 2017 $22,678.70 70.00% 2018 $24,807,60 70.00% 2019 $26,256 60 70 00% 2020 527,422.10 70 00% 2021 $29,600 49 70.00% 2022 $31,506 22 70.00% 2023 $34,875 53 70.00% 2024 $37,275 25 70 00% 2025 $39,793 38 70.00% 50.00% $40,00000 $35,000.00 $30,000.00 $25,000.00 $20.000,00 $15,000.00 $10,000.00 $5,000.00 40 00 30.00% Dividends -Dividend Payout Ratio 20.00% 2024 2025 2022 2023 2020 2021 2018 2019 10.00% 50.00 0.00% 2016 2017 Year . Do you think the lender would have any concerns with WCC keeping the same dividend payout ratio after the acquisition? Provide an explanation Based on 2021, explain if WCC is more or less leveraged, than the competitors. Management has indicated that a multiple of 10X EBITDA is reasonable to value the invested capital of WCc. Explain if and why shareholder value has been created or reduced from the acquisition when comparing the 2020 value per share to the 2021 value . per share
Step by Step Solution
There are 3 Steps involved in it

Get step-by-step solutions from verified subject matter experts