

Question: Given information from table below, please calculate the following: 1 ) the slope of the CAL, 2) the optimal risky asset weight 3) the expected
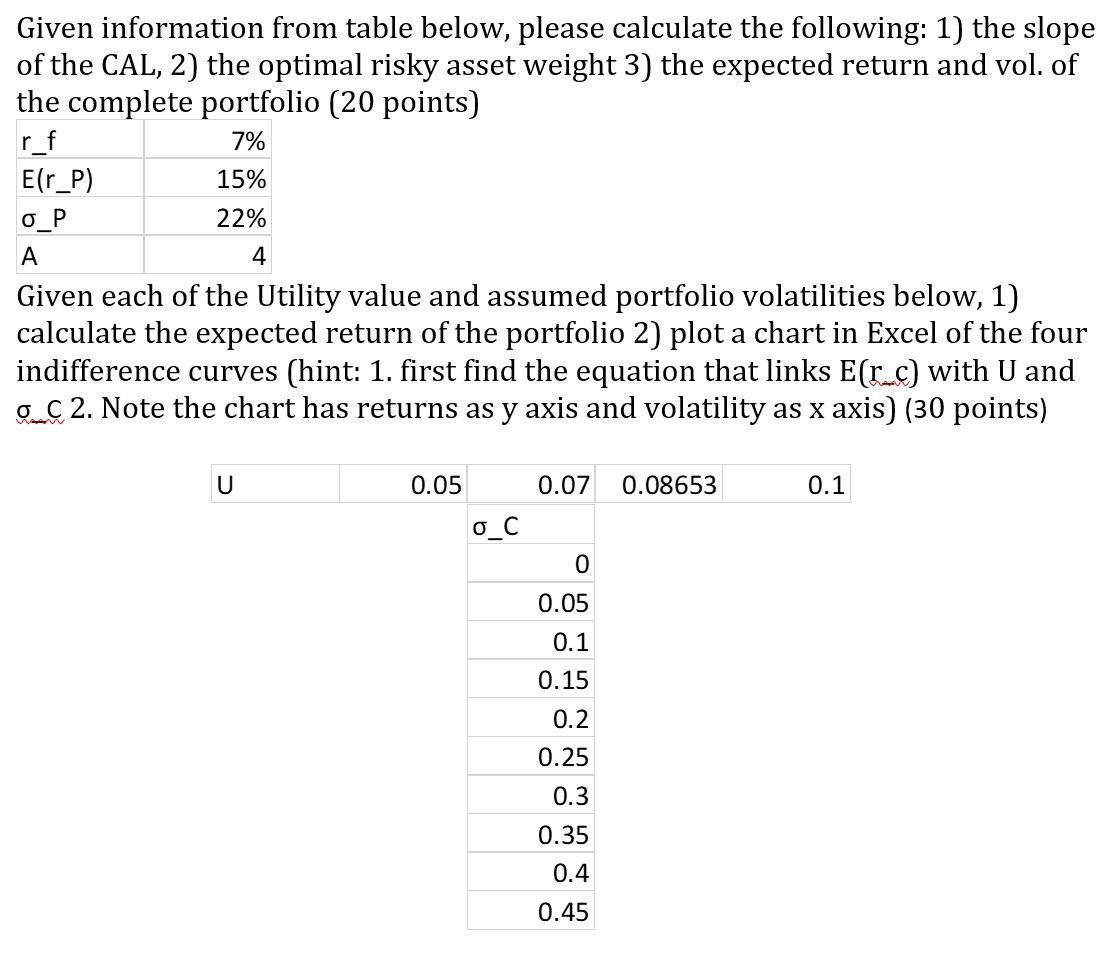
Given information from table below, please calculate the following: 1 ) the slope of the CAL, 2) the optimal risky asset weight 3) the expected return and vol. of the complete portfolio ( 20 points) Given each of the Utility value and assumed portfolio volatilities below, 1) calculate the expected return of the portfolio 2) plot a chart in Excel of the four indifference curves (hint: 1. first find the equation that links E(rrC) with U and mC. Note the chart has returns as y axis and volatility as x axis) ( 30 points) Given information from table below, please calculate the following: 1 ) the slope of the CAL, 2) the optimal risky asset weight 3) the expected return and vol. of the complete portfolio ( 20 points) Given each of the Utility value and assumed portfolio volatilities below, 1) calculate the expected return of the portfolio 2) plot a chart in Excel of the four indifference curves (hint: 1. first find the equation that links E(rrC) with U and mC. Note the chart has returns as y axis and volatility as x axis) ( 30 points)
Step by Step Solution
There are 3 Steps involved in it

Get step-by-step solutions from verified subject matter experts