

Question: GIVEN: Read Section 1 1 - 2 0 to 1 1 - 2 3 in your book. The following table represents field data with elevations
GIVEN:
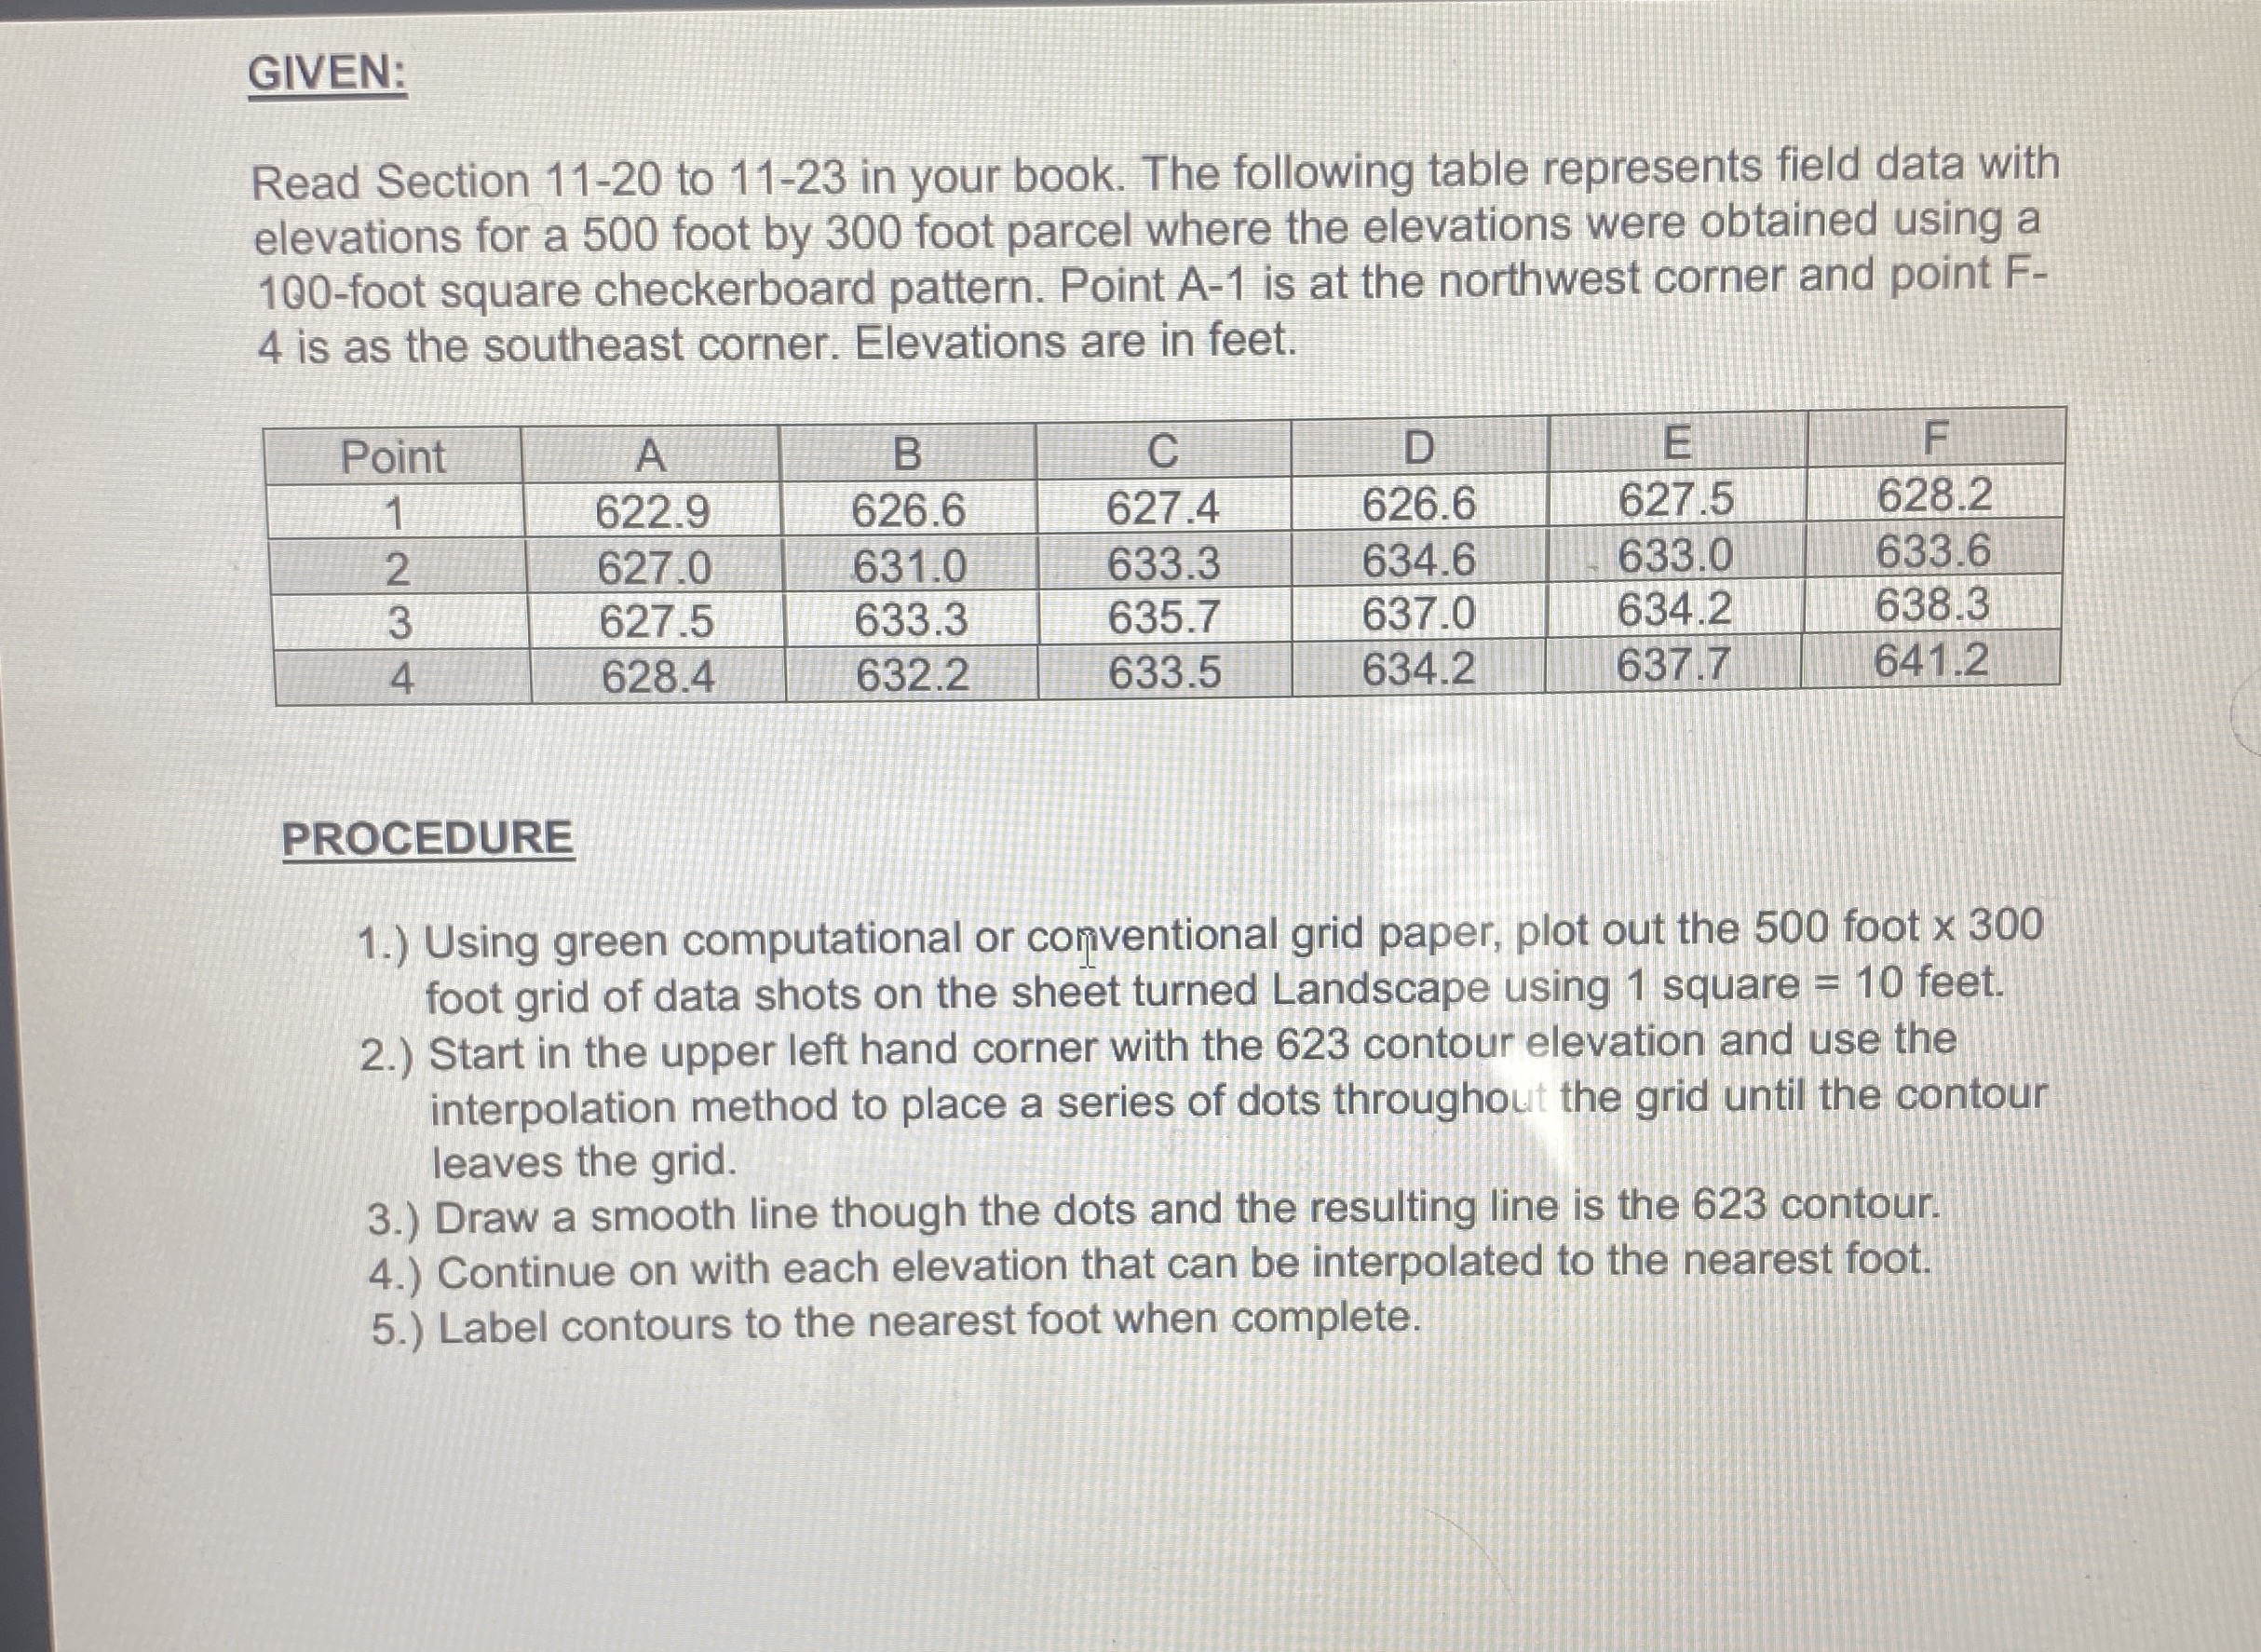
Read Section to in your book. The following table represents field data with elevations for a foot by foot parcel where the elevations were obtained using a foot square checkerboard pattern. Point A is at the northwest corner and point F is as the southeast corner. Elevations are in feet.
tablePointABCDEF
PROCEDURE
Using green computational or conventional grid paper, plot out the foot foot grid of data shots on the sheet turned Landscape using square feet.
Start in the upper left hand corner with the contour elevation and use the interpolation method to place a series of dots throughout the grid until the contour leaves the grid.
Draw a smooth line though the dots and the resulting line is the contour.
Continue on with each elevation that can be interpolated to the nearest foot.
Label contours to the nearest foot when complete.
Step by Step Solution
There are 3 Steps involved in it
1 Expert Approved Answer
Step: 1 Unlock

Question Has Been Solved by an Expert!
Get step-by-step solutions from verified subject matter experts
Step: 2 Unlock
Step: 3 Unlock