

Question: Given recently acquired laboratory data tabulated below, you are required to: a) Copy and Complete the attached table and submit, b) To plot the cumulative
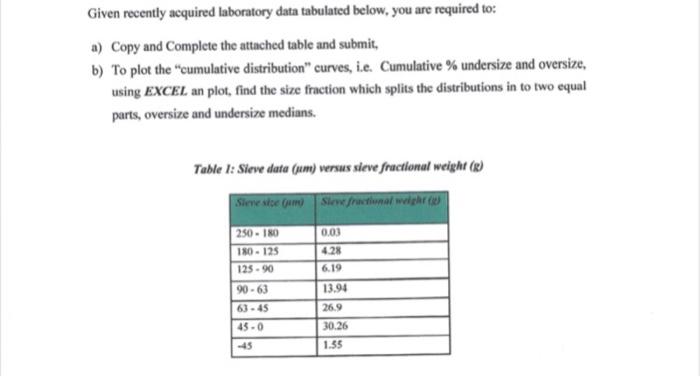
Given recently acquired laboratory data tabulated below, you are required to: a) Copy and Complete the attached table and submit, b) To plot the "cumulative distribution" curves, i.e. Cumulative % undersize and oversize, using EXCEL an plot, find the size fraction which splits the distributions in to two equal parts, oversize and undersize medians. Table 1: Sieve data (um) versus sieve fractional weight (s) Given recently acquired laboratory data tabulated below, you are required to: a) Copy and Complete the attached table and submit, b) To plot the "cumulative distribution" curves, i.e. Cumulative % undersize and oversize, using EXCEL an plot, find the size fraction which splits the distributions in to two equal parts, oversize and undersize medians. Table 1: Sieve data (um) versus sieve fractional weight (s)
Step by Step Solution
There are 3 Steps involved in it

Get step-by-step solutions from verified subject matter experts