

Question: Given table below answer the questions. Table 21.1 One-Year Ratings Transition Matrix, 1970-2016, with Probabilities Expressed as Percentages and Adjustments for Transition to the WR
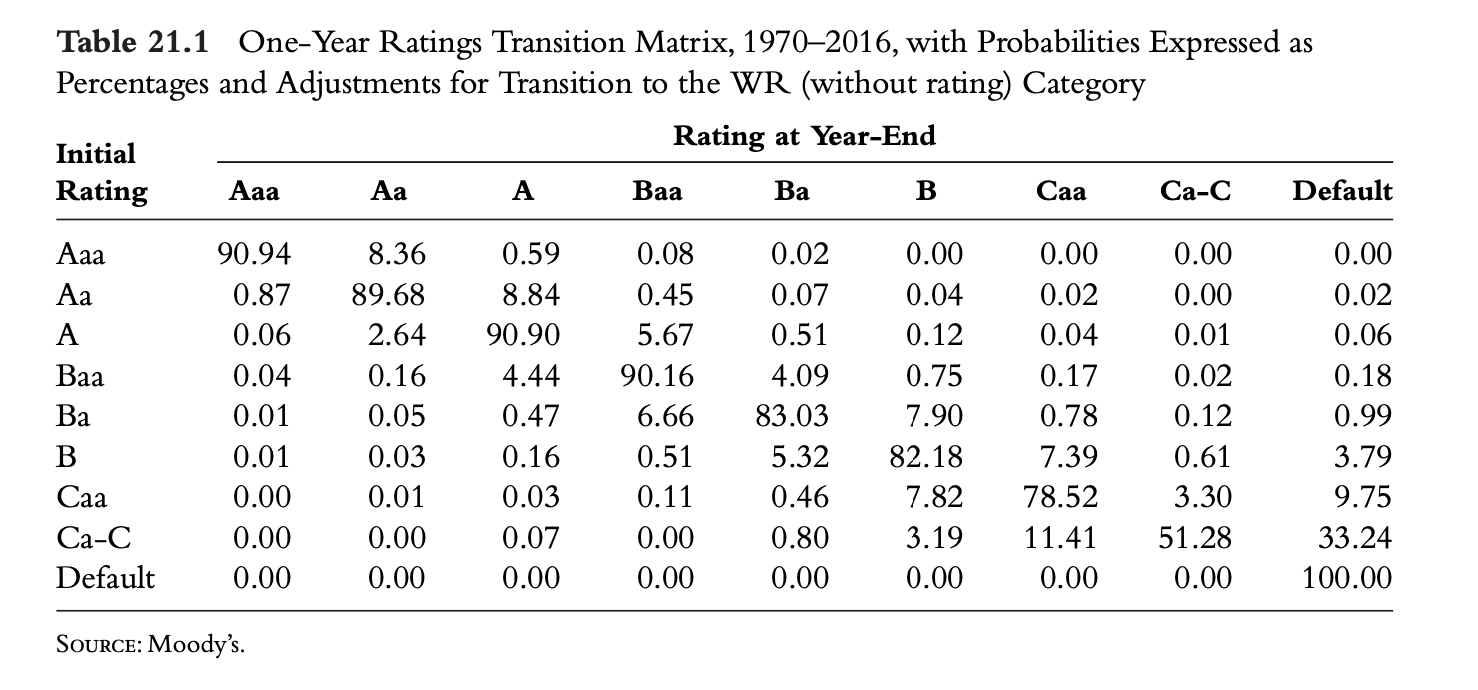
Table 21.1 One-Year Ratings Transition Matrix, 1970-2016, with Probabilities Expressed as Percentages and Adjustments for Transition to the WR (without rating) Category Rating at Year-End Initial Rating Aaa Aa A Baa Ba B Caa Ca-C Default Aaa 90.94 8.36 0.59 0.08 0.02 0.00 0.00 0.00 0.00 Aa 0.87 89.68 8.84 0.45 0.07 0.04 0.02 0.00 0.02 A 0.06 2.64 90.90 5.67 0.51 0.12 0.04 0.01 0.06 Baa 0.04 0.16 4.44 90.16 4.09 0.75 0.17 0.02 0.18 Ba 0.01 0.05 0.47 6.66 83.03 7.90 0.78 0.12 0.99 B 0.01 0.03 0.16 0.51 5.32 82.18 7.39 0.61 3.79 Caa 0.00 0.01 0.03 0.11 0.46 7.82 78.52 3.30 9.75 Ca-C 0.00 0.00 0.07 0.00 0.80 3.19 11.41 51.28 33.24 Default 0.00 0.00 0.00 0.00 0.00 0.00 0.00 0.00 100.00 SOURCE: Moody's.
Step by Step Solution
There are 3 Steps involved in it

Get step-by-step solutions from verified subject matter experts