

Question: Given that a one-sample t-test is completed to test H 0 = 100 versus H 1 : > 100 using a sample size of n=30,
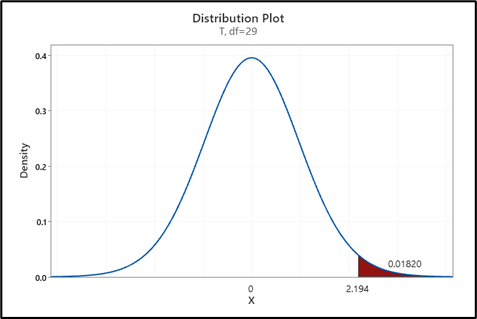

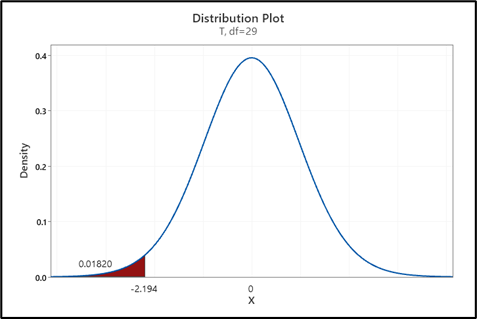

- Given that a one-sample t-test is completed to test H0 = 100 versus H1: > 100 using a sample size of n=30, and the resulting test statistic is t = 2.194, which of the following sketches has a shaded region that represents the p-value associated with this hypothesis test?


\fDistribution Plot T, df=30 0.4 0.3 Density 0.2 0.1- 0.01806 0.0 2.194 XODistribution Plot T, df=29 0.4 0.3 Density 0.2 0.1- 0.01820 0.0 -2.194 XODistribution Plot T, df=30 0.4 0.3 Density 0.2 0.1- 0.01806 0.0 -2.194 XO
Step by Step Solution
There are 3 Steps involved in it
1 Expert Approved Answer
Step: 1 Unlock

Question Has Been Solved by an Expert!
Get step-by-step solutions from verified subject matter experts
Step: 2 Unlock
Step: 3 Unlock