

Question: Given that the current wage is $75 and the price of output (Q) is equal to $2.00, complete the table on your exam sheet. Use
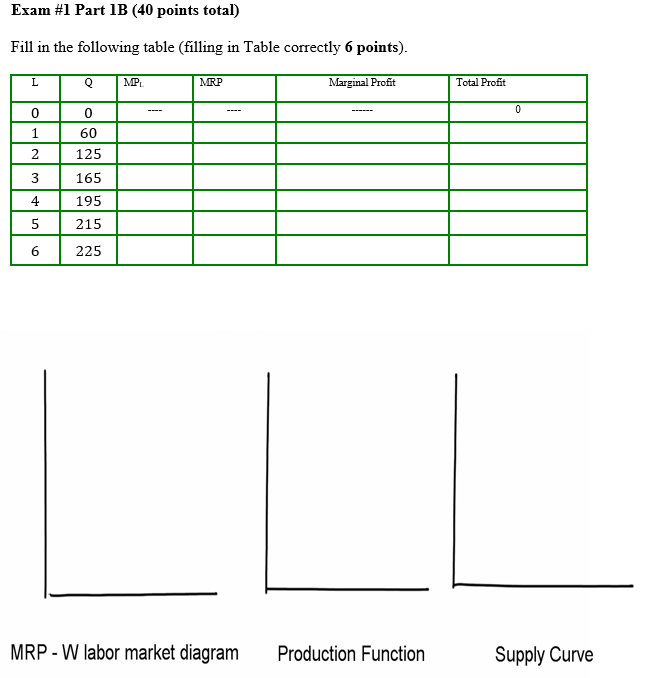
Given that the current wage is $75 and the price of output (Q) is equal to $2.00, complete the table on your exam sheet.
Use the table on your exam sheet to answer the following questions:
- How many workers will the firm hire to maximize profits?
- What are the maximum profits?
- How much output is produced at profit maximization?
Now draw the W/MRP Labor Market Diagram associated with the table above on the area indicated on your exam sheet. Draw this as we did in the lectures, being sure to be clear on the areas that represent:
- labor costs,
- MRP (label the curve exactly as we did in lectures and homework), and
- the profit or loss (with actual numbers)
- Identify L* (as we did in lectures)
Use different colors if at all possible.
Label this initial point where the firm maximizes profit as point A.
Draw a production function diagram in the indicated area on your exam sheet, making sure you label the diagram completely including this initial point as Point A.
Draw a supply curve on your exam sheet in the indicated area. Locate Point A consistent with your Points A above. To get a second point on this original supply curve, pretend that prices go up by a dollar and map out the change in the profit maximizing output, like we did in the lectures. This will give us our original supply curve
\f
Step by Step Solution
There are 3 Steps involved in it

Get step-by-step solutions from verified subject matter experts