

Question: Given the 4412 Efficient Portfolio Spreadsheet ---Complete Tab, determine the following: 1. Find the efficient portfolio that provides an expected return of 9.8% (short selling
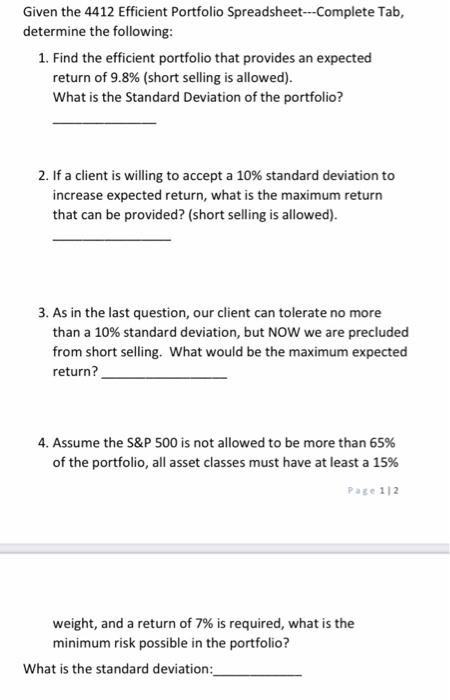

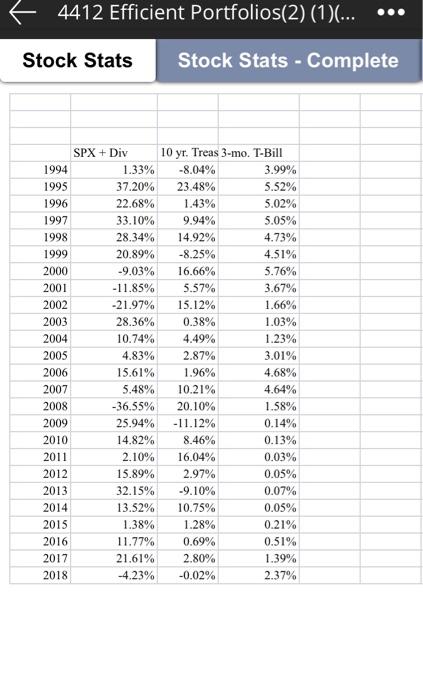


Given the 4412 Efficient Portfolio Spreadsheet ---Complete Tab, determine the following: 1. Find the efficient portfolio that provides an expected return of 9.8% (short selling is allowed). What is the Standard Deviation of the portfolio? 2. If a client is willing to accept a 10% standard deviation to increase expected return, what is the maximum return that can be provided? (short selling is allowed). 3. As in the last question, our client can tolerate no more than a 10% standard deviation, but NOW we are precluded from short selling. What would be the maximum expected return? 4. Assume the S&P 500 is not allowed to be more than 65% of the portfolio, all asset classes must have at least a 15% Page 112 weight, and a return of 7% is required, what is the minimum risk possible in the portfolio? What is the standard deviation: + 4412 Efficient Portfolios(2) (1)... Stock Stats Stock Stats - Complete SPX + Div 10 yr. Treas 3-mo. T-Bill Average Return Variance of Returns Standard Deviation of Returns SPX 10 3 mo Covariance Matrix SPX 10 yr 3 mo Correlation Matrix SPX 10 3 mo SPX 10 yr 3 mo Coefficient of Variation 4412 Efficient Portfolios(2) (1)... Stock Stats Stock Stats - Complete SPX + Div 1994 1.33% 1995 37.20% 1996 22.68% 1997 33.10% 1998 28.34% 1999 20.89% 2000 -9.03% 2001 -11.85% 2002 -21.97% 2003 28.36% 2004 10.74% 2005 4.83% 2006 15.61% 2007 5.48% 2008 -36.55% 2009 25.94% 2010 14.82% 2011 2.10% 2012 15.89% 2013 32.15% 2014 13.52% 2015 1.38% 2016 11.77% 2017 21.61% 2018 -4.23% 10 yr. Treas 3-mo. T-Bill -8.04% 3.99% 23.48% 5.52% 1.43% 5.02% 9.94% 5.05% 14.92% 4.73% -8.25% 4.51% 16.66% 5.76% 5.57% 3.67% 15.12% 1.66% 0.38% 1.03% 4.49% 1.23% 2.87% 3.01% 1.96% 4.68% 10.21% 4.64% 20.10% 1.58% -11.12% 0.14% 8.46% 0.13% 16.04% 0.03% 2.97% 0.05% -9.10% 0.07% 10.75% 0.05% 1.28% 0.21% 0.69% 0.51% 2.80% 1.39% -0.02% 2.37% Stock Stats Stock Stats - Complete Av Vai Sta Co 1994 1995 1996 1997 1998 1999 2000 2001 2002 2003 2004 2005 2006 2007 2008 2009 2010 2011 2012 2013 2014 2015 2016 2017 2018 SPX + Div 1.33% 37.20% 22.68% 33.10% 28.34% 20.89% -9.03% -11.85% -21.97% 28.36% 10.74% 4.83% 15.61% 5.48% -36.55% 25.94% 14.82% 2.10% 15.89% 32.15% 13.52% 1.38% 11.77% 21.61% -4.23% 10 yr. Treas 3-mo. T-Bill -8.04% 3.99% 23.48% 5.52% 1.43% 5.02% 9.94% 5.05% 14.92% 4.73% -8.25% 4.51% 16.66% 5.76% 5.57% 3.67% 15.12% 1.66% 0.38% 1.03% 4.49% 1.23% 2.87% 3.01% 1.96% 4.68% 10.21% 4.64% 20.10% 1.58% -11.12% 0.14% 8.46% 0.13% 16.04% 0.03% 2.97% 0.05% -9.10% 0.07% 10.75% 0.05% 1.28% 0.21% 0.69% 0.51% 2.80% 1.39% -0.02% 2.37% 6 2 4412 Efficient Portfolios(2) (1)... Stock Stats Stock Stats - Complete - Average Return Variance of Returns Standard Deviation of Returns SPX + Div 10.56% 3.21% 17.90% 10 yr. Treas 3-mo. T-Bill 5.34% 2.44% 0.85% 0.04% 9.22% 2.10% Covariance Matrix 3 mo SPX 10 yr SPX 3.21% 10 yr -0.00508048 0.85% 3 mo 0.00031693245 0.00046355 0.04% Correlation Matrix 10 3 mo SPX 10 yr SPX 1.00 -0.31 0.08 1.00 0.24 3 mo 1.00 Coefficient of Variation 1.69 1.73 0.86 Given the 4412 Efficient Portfolio Spreadsheet ---Complete Tab, determine the following: 1. Find the efficient portfolio that provides an expected return of 9.8% (short selling is allowed). What is the Standard Deviation of the portfolio? 2. If a client is willing to accept a 10% standard deviation to increase expected return, what is the maximum return that can be provided? (short selling is allowed). 3. As in the last question, our client can tolerate no more than a 10% standard deviation, but NOW we are precluded from short selling. What would be the maximum expected return? 4. Assume the S&P 500 is not allowed to be more than 65% of the portfolio, all asset classes must have at least a 15% Page 112 weight, and a return of 7% is required, what is the minimum risk possible in the portfolio? What is the standard deviation: + 4412 Efficient Portfolios(2) (1)... Stock Stats Stock Stats - Complete SPX + Div 10 yr. Treas 3-mo. T-Bill Average Return Variance of Returns Standard Deviation of Returns SPX 10 3 mo Covariance Matrix SPX 10 yr 3 mo Correlation Matrix SPX 10 3 mo SPX 10 yr 3 mo Coefficient of Variation 4412 Efficient Portfolios(2) (1)... Stock Stats Stock Stats - Complete SPX + Div 1994 1.33% 1995 37.20% 1996 22.68% 1997 33.10% 1998 28.34% 1999 20.89% 2000 -9.03% 2001 -11.85% 2002 -21.97% 2003 28.36% 2004 10.74% 2005 4.83% 2006 15.61% 2007 5.48% 2008 -36.55% 2009 25.94% 2010 14.82% 2011 2.10% 2012 15.89% 2013 32.15% 2014 13.52% 2015 1.38% 2016 11.77% 2017 21.61% 2018 -4.23% 10 yr. Treas 3-mo. T-Bill -8.04% 3.99% 23.48% 5.52% 1.43% 5.02% 9.94% 5.05% 14.92% 4.73% -8.25% 4.51% 16.66% 5.76% 5.57% 3.67% 15.12% 1.66% 0.38% 1.03% 4.49% 1.23% 2.87% 3.01% 1.96% 4.68% 10.21% 4.64% 20.10% 1.58% -11.12% 0.14% 8.46% 0.13% 16.04% 0.03% 2.97% 0.05% -9.10% 0.07% 10.75% 0.05% 1.28% 0.21% 0.69% 0.51% 2.80% 1.39% -0.02% 2.37% Stock Stats Stock Stats - Complete Av Vai Sta Co 1994 1995 1996 1997 1998 1999 2000 2001 2002 2003 2004 2005 2006 2007 2008 2009 2010 2011 2012 2013 2014 2015 2016 2017 2018 SPX + Div 1.33% 37.20% 22.68% 33.10% 28.34% 20.89% -9.03% -11.85% -21.97% 28.36% 10.74% 4.83% 15.61% 5.48% -36.55% 25.94% 14.82% 2.10% 15.89% 32.15% 13.52% 1.38% 11.77% 21.61% -4.23% 10 yr. Treas 3-mo. T-Bill -8.04% 3.99% 23.48% 5.52% 1.43% 5.02% 9.94% 5.05% 14.92% 4.73% -8.25% 4.51% 16.66% 5.76% 5.57% 3.67% 15.12% 1.66% 0.38% 1.03% 4.49% 1.23% 2.87% 3.01% 1.96% 4.68% 10.21% 4.64% 20.10% 1.58% -11.12% 0.14% 8.46% 0.13% 16.04% 0.03% 2.97% 0.05% -9.10% 0.07% 10.75% 0.05% 1.28% 0.21% 0.69% 0.51% 2.80% 1.39% -0.02% 2.37% 6 2 4412 Efficient Portfolios(2) (1)... Stock Stats Stock Stats - Complete - Average Return Variance of Returns Standard Deviation of Returns SPX + Div 10.56% 3.21% 17.90% 10 yr. Treas 3-mo. T-Bill 5.34% 2.44% 0.85% 0.04% 9.22% 2.10% Covariance Matrix 3 mo SPX 10 yr SPX 3.21% 10 yr -0.00508048 0.85% 3 mo 0.00031693245 0.00046355 0.04% Correlation Matrix 10 3 mo SPX 10 yr SPX 1.00 -0.31 0.08 1.00 0.24 3 mo 1.00 Coefficient of Variation 1.69 1.73 0.86
Step by Step Solution
There are 3 Steps involved in it

Get step-by-step solutions from verified subject matter experts