

Question: Given the above chart for Kellog, Discuss how the stock for Kellog Co is trending. Explain why the stock is in either an uptrend or
Given the above chart for Kellog,
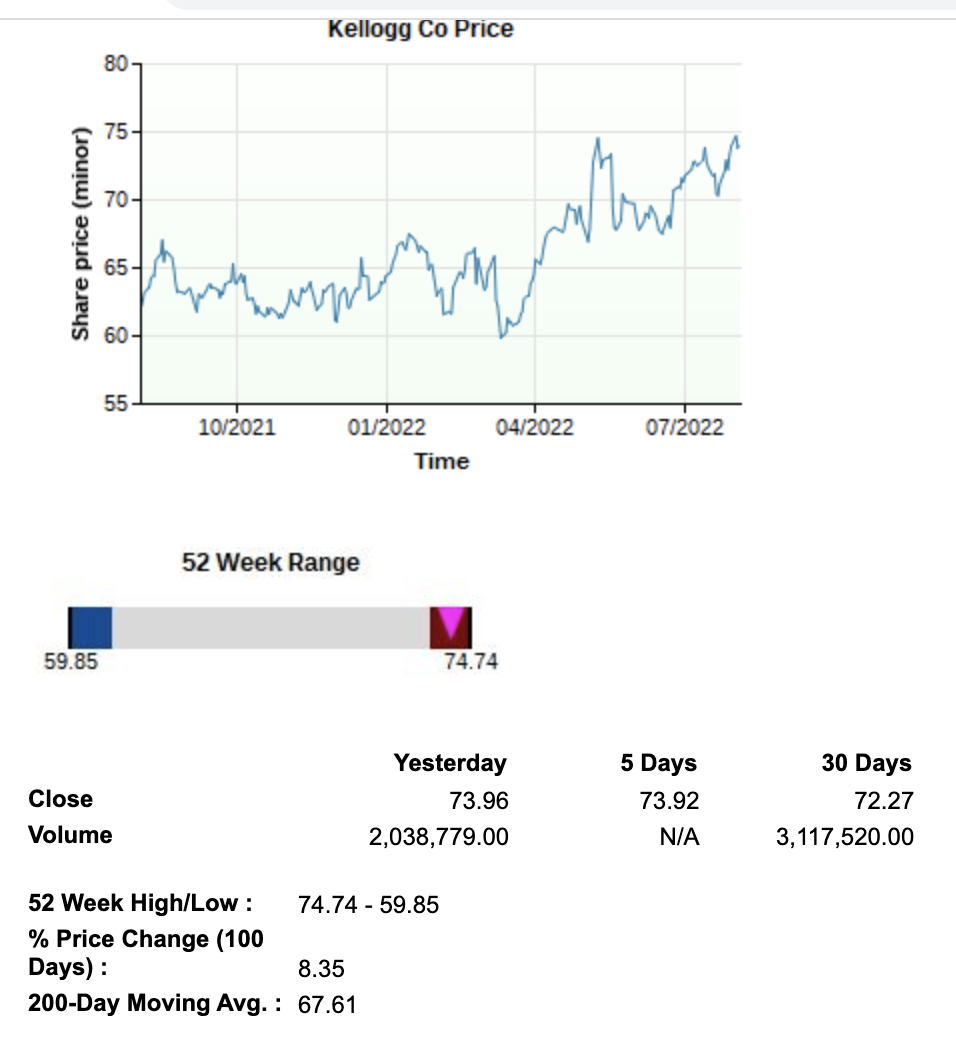
- Discuss how the stock for Kellog Co is trending. Explain why the stock is in either an uptrend or downtrend and will you recommend this stock to a friend? why or why not. support your answers with a financial analysis base on the chart.
Kellogg Co Price 52 Week Range CloseVolumeYesterday73.962,038,779.005Days73.92N/A30Days72.273,117,520.00 52 Week High/Low : 74.7459.85 \% Price Change 100 Days) : 8.35 200-Day Moving Avg. : 67.61
Step by Step Solution
There are 3 Steps involved in it
1 Expert Approved Answer
Step: 1 Unlock

Question Has Been Solved by an Expert!
Get step-by-step solutions from verified subject matter experts
Step: 2 Unlock
Step: 3 Unlock