

Question: Given the above data tables for wind distribution at a given site (for about a year) and the power curves, estimate the energy produced during
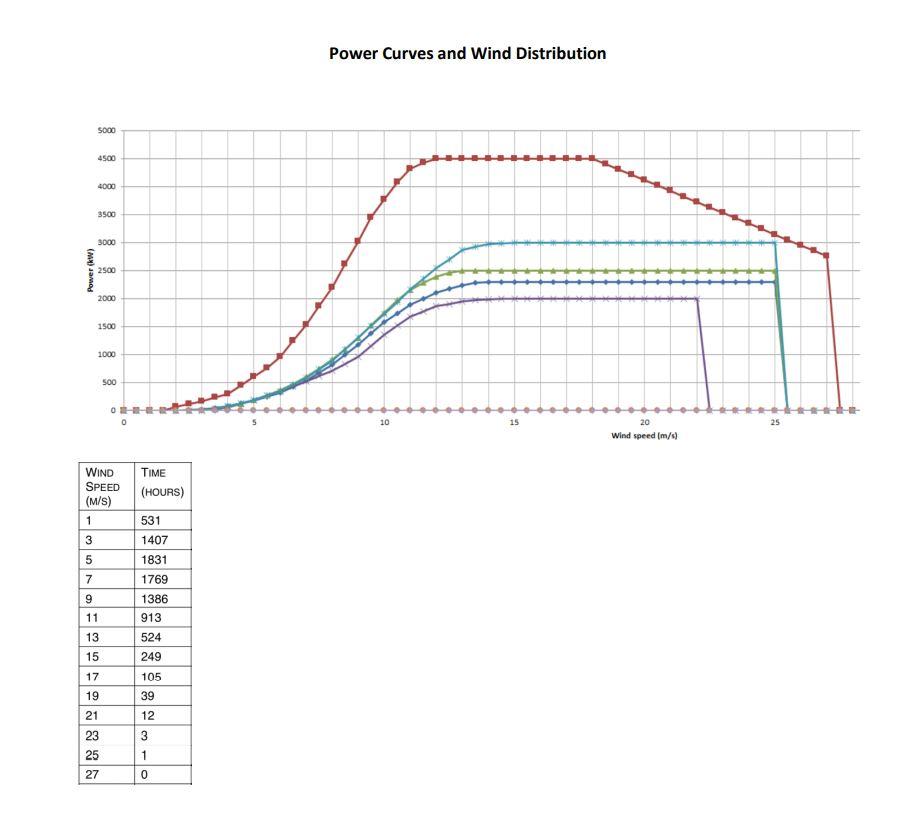
Given the above data tables for wind distribution at a given site (for about a year) and the power curves, estimate the energy produced during this data gathering period (about a year) for both the red (tallest) and the light blue (2nd tallest) curves. Assume that wind speed bin 1 M/S represents hours from 0 to 2 m/s, then 3 M/S represents hours from 2 to 4 m/s, and so on. What is the average or expected power for both of these types of turbines? Assuming the taller curve turbine costs 2 million dollars and the 2nd tallest curve turbine costs 1.2 million dollars, estimate how long before the more expensive turbine has caught up with the other turbine? Assume a PPA price of $160/MWh. State any other assumptions that you might make clearly. (Neglect production tax credit, time value of money, and other such complications)
Power Curves and Wind Distribution S000 4500 4000 3500 3000 Power (kw) 2500 2000 1500 1000 500 0 . . 20 15 25 20 Wind speed (m/s) WIND SPEED (M/S) 1 TIME (HOURS) 531 3 1407 5 1831 7 1769 9 1386 913 11 13 524 15 249 17 105 19 39 12 21 23 25 27 3 1 0 Power Curves and Wind Distribution S000 4500 4000 3500 3000 Power (kw) 2500 2000 1500 1000 500 0 . . 20 15 25 20 Wind speed (m/s) WIND SPEED (M/S) 1 TIME (HOURS) 531 3 1407 5 1831 7 1769 9 1386 913 11 13 524 15 249 17 105 19 39 12 21 23 25 27 3 1 0
Step by Step Solution
There are 3 Steps involved in it

Get step-by-step solutions from verified subject matter experts