

Question: Given the above stock data can someone explain how to calculate the following and provide sample calculations: Monthly returns; Expected return; Standard deviation of the
Given the above stock data can someone explain how to calculate the following and provide sample calculations:
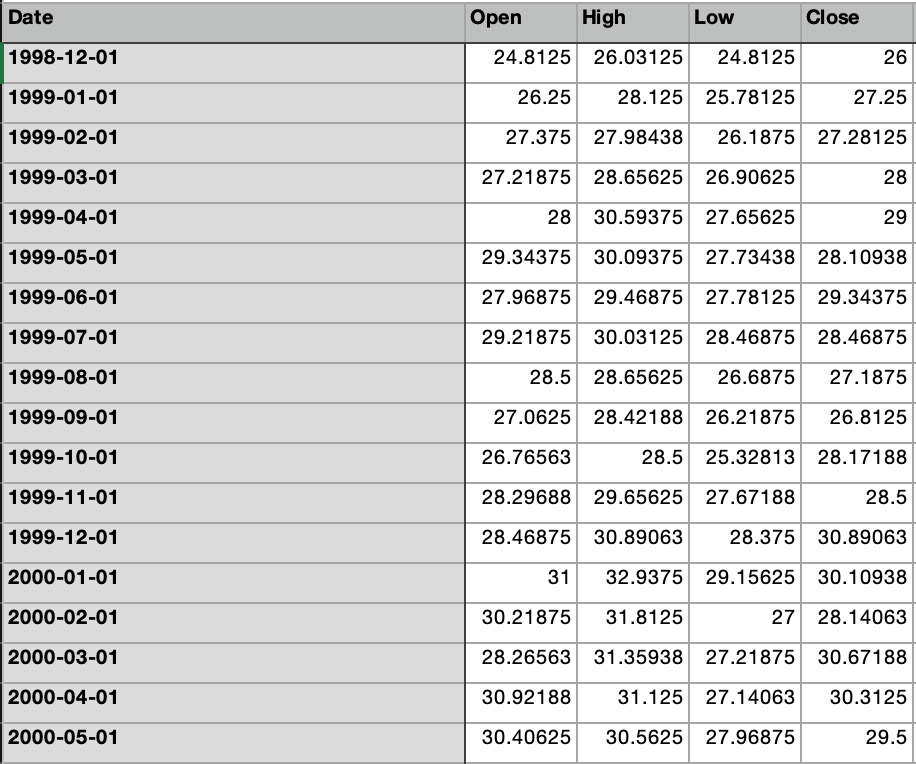
Monthly returns; Expected return; Standard deviation of the returns; Sharp ratio; Skew; Kurtosis; LPSD; Sortino ratio VaR (5%); Expected Shortfall (5%)
Date Open High Low Close 1998-12-01 24.8125 26.03125 24.8125 26 1999-01-01 26.25 28.125 25.78125 27.25 1999-02-01 27.375 27.98438 26.1875 27.28125 1999-03-01 27.21875 28.65625 26.90625 28 1999-04-01 28 30.59375 27.65625 29 1999-05-01 29.34375 30.09375 27.73438 28.10938 1999-06-01 27.96875 29.46875 29.46875 27.78125 29.34375 1999-07-01 29.21875 30.03125 28.46875 28.46875 1999-08-01 28.5 28.65625 26.6875 27.1875 1999-09-01 27.0625 28.42188 26.21875 26.8125 1999-10-01 26.76563 28.5 25.32813 28.17188 1999-11-01 28.29688 29.65625 27.67188 28.5 1999-12-01 28.46875 30.89063 28.375 30.89063 2000-01-01 31 32.9375 29.15625 30.10938 2000-02-01 30.21875 31.8125 27 28.14063 2000-03-01 28.26563 31.35938 27.21875 30.67188 2000-04-01 30.92188 31.125 27.14063 30.3125 2000-05-01 30.40625 30.5625 27.96875 29.5
Step by Step Solution
There are 3 Steps involved in it

Get step-by-step solutions from verified subject matter experts