

Question: Given the charts and the Data from Stats. Please give mr a financial analysis and summary. including shat the r-squared, adjusted r-squared, which variables are
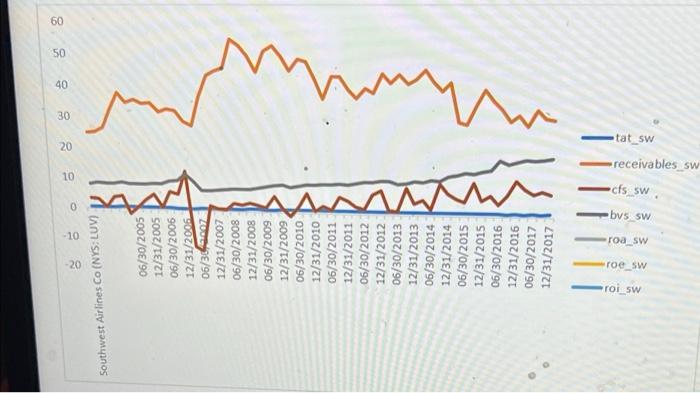
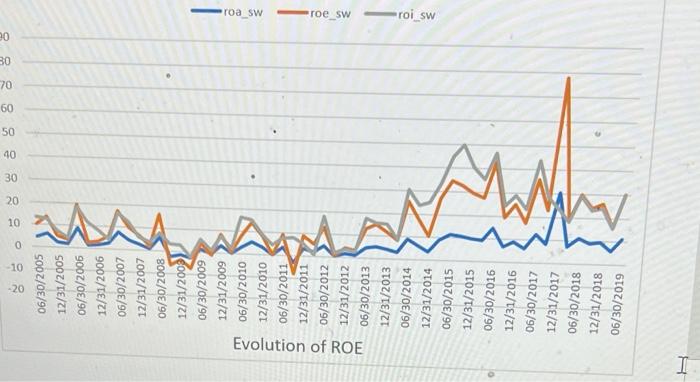
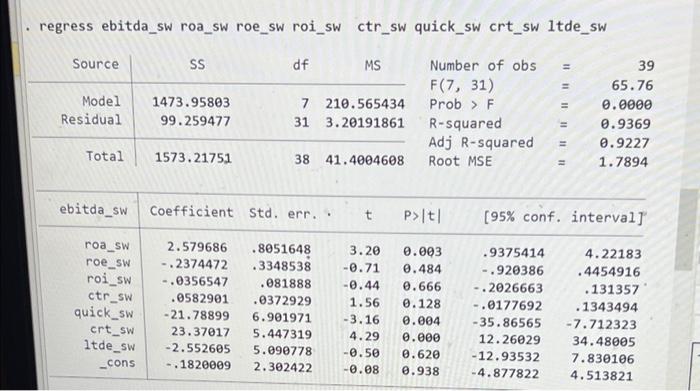
Southwest Airlines Co (NYS: LUV 06/30/2005 12/31/2005 06/30/2006 12/31/2005 06/36.00 12/31/2007 06/30/2008 12/31/2008 06/30/2009 12/31/2009 06/30/2010 12/31/2010 06/30/2011 12/31/2011 06/30/2012 12/31/2012 06/30/2013 12/31/2013 06/30/2014 12/31/2014 06/30/2015 12/31/2015 06/30/2016 12/31/2016 06/30/2017 12/31/2017 -roi sw roe_sw roa sw -bvs sw cfs sw tat sw receivables sw 30 oe O roa sw Evolution of ROE 06/30/2005 12/31/2005 06/30/2006 12/31/2006 06/30/2007 12/31/2007 06/30/2008 12/31/2002 06/30/2009 12/31/2009 06/30/2010 12/31/2010 06/30/2011 12/31/2011 06/30/2012 12/31/2012 06/30/2013 12/31/2013 06/30/2014 12/31/2014 06/30/2015 12/31/2015 06/30/2016 | roe swoi sw M 12/31/2016 06/30/2017 12/31/2017 06/30/2018 12/31/2018 06/30/2019 regress ebitda_sw roa_sw roe_sw roi_sw ctr_sw quick_sw crt_sw ltde_SW Source SS df MS Model Residual 1473.95803 99.259477 7 210.565434 31 3.20191861 Number of obs F(7, 31) Prob > F R-squared Adj R-squared Root MSE 11111111111 39 65.76 0.0000 0.9369 0.9227 1.7894 Total 1573.21751 38 41.4004608 ebitda_sw Coefficient Std. err.. t P>It! [95% conf. intervall roa_sw roe_sw roi_sw ctr_sw quick_sw crt_sw ltde_sw 2.579686 -.2374472 -.0356547 .0582901 -21.78899 23.37017 -2.552605 -. 1820009 .8051648 .3348538 .081888 .0372929 6.901971 5.447319 5.090778 2.302422 3.20 -0.71 -0.44 1.56 -3.16 4.29 -0.50 -0.08 0.003 0.484 0.666 0.128 0.004 0.000 0.620 0.938 .9375414 -.920386 -.2026663 -.0177692 -35.86565 12.26029 -12.93532 -4.877822 4.22183 .4454916 . 131357 .1343494 - 7.712323 34.48005 7.830106 4.513821 -cons Southwest Airlines Co (NYS: LUV 06/30/2005 12/31/2005 06/30/2006 12/31/2005 06/36.00 12/31/2007 06/30/2008 12/31/2008 06/30/2009 12/31/2009 06/30/2010 12/31/2010 06/30/2011 12/31/2011 06/30/2012 12/31/2012 06/30/2013 12/31/2013 06/30/2014 12/31/2014 06/30/2015 12/31/2015 06/30/2016 12/31/2016 06/30/2017 12/31/2017 -roi sw roe_sw roa sw -bvs sw cfs sw tat sw receivables sw 30 oe O roa sw Evolution of ROE 06/30/2005 12/31/2005 06/30/2006 12/31/2006 06/30/2007 12/31/2007 06/30/2008 12/31/2002 06/30/2009 12/31/2009 06/30/2010 12/31/2010 06/30/2011 12/31/2011 06/30/2012 12/31/2012 06/30/2013 12/31/2013 06/30/2014 12/31/2014 06/30/2015 12/31/2015 06/30/2016 | roe swoi sw M 12/31/2016 06/30/2017 12/31/2017 06/30/2018 12/31/2018 06/30/2019 regress ebitda_sw roa_sw roe_sw roi_sw ctr_sw quick_sw crt_sw ltde_SW Source SS df MS Model Residual 1473.95803 99.259477 7 210.565434 31 3.20191861 Number of obs F(7, 31) Prob > F R-squared Adj R-squared Root MSE 11111111111 39 65.76 0.0000 0.9369 0.9227 1.7894 Total 1573.21751 38 41.4004608 ebitda_sw Coefficient Std. err.. t P>It! [95% conf. intervall roa_sw roe_sw roi_sw ctr_sw quick_sw crt_sw ltde_sw 2.579686 -.2374472 -.0356547 .0582901 -21.78899 23.37017 -2.552605 -. 1820009 .8051648 .3348538 .081888 .0372929 6.901971 5.447319 5.090778 2.302422 3.20 -0.71 -0.44 1.56 -3.16 4.29 -0.50 -0.08 0.003 0.484 0.666 0.128 0.004 0.000 0.620 0.938 .9375414 -.920386 -.2026663 -.0177692 -35.86565 12.26029 -12.93532 -4.877822 4.22183 .4454916 . 131357 .1343494 - 7.712323 34.48005 7.830106 4.513821 -cons
Step by Step Solution
There are 3 Steps involved in it

Get step-by-step solutions from verified subject matter experts