

Question: Given the data above, calculate the linear correlation coefficient r a. 0.94 b. 0.35 c. 0.54 d. 0.88 e. 0.12 2) A survey administered to
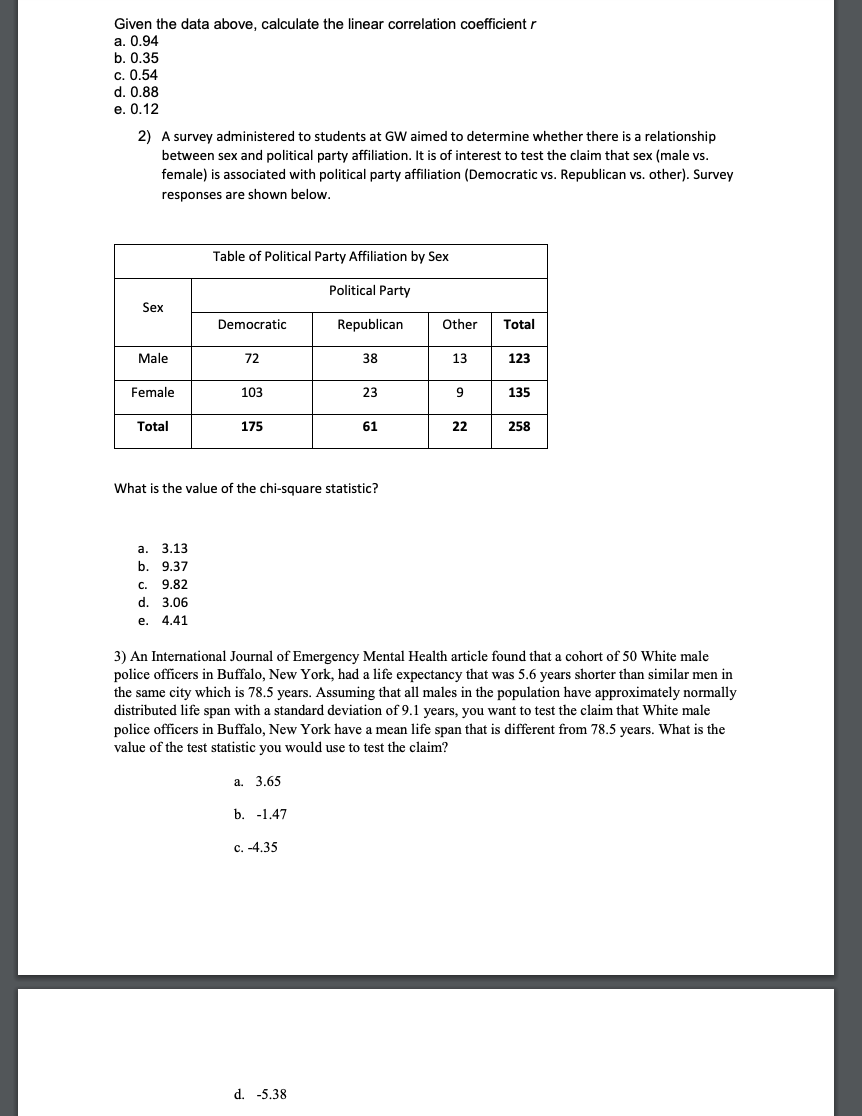
Given the data above, calculate the linear correlation coefficient r a. 0.94 b. 0.35 c. 0.54 d. 0.88 e. 0.12 2) A survey administered to students at GW aimed to determine whether there is a relationship between sex and political party affiliation. It is of interest to test the claim that sex (male vs. female) is associated with political party affiliation (Democratic vs. Republican vs. other). Survey responses are shown below. Table of Political Party Affiliation by Sex Political Party Sex Democratic Republican Other Total Male 72 38 13 123 Female 103 23 9 135 Total 175 61 22 258 What is the value of the chi-square statistic? a. 3.13 b. 9.37 C. 9.82 d. 3.06 e. 4.41 3) An International Journal of Emergency Mental Health article found that a cohort of 50 White male police officers in Buffalo, New York, had a life expectancy that was 5.6 years shorter than similar men in the same city which is 78.5 years. Assuming that all males in the population have approximately normally distributed life span with a standard deviation of 9.1 years, you want to test the claim that White male police officers in Buffalo, New York have a mean life span that is different from 78.5 years. What is the value of the test statistic you would use to test the claim? a. 3.65 b. -1.47 c. -4.35 d. -5.38
Step by Step Solution
There are 3 Steps involved in it

Get step-by-step solutions from verified subject matter experts